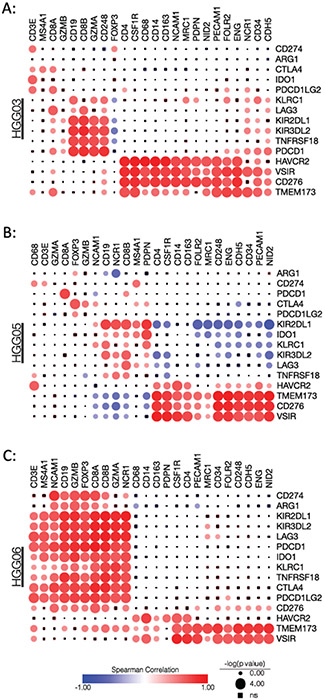
Figure 7: Correlations between immunotherapeutic targets and different cell type markers.
Spearman correlation matrix showing the relationships between genes encoding immunotherapeutic targets and marker genes for lymphocytes, monocytes/macrophages, endothelial cells, and glioma cells in specimens (A) HGG03, (B) HGG05, and (C) HGG06. Circle size indicates p value where circles with inlaid black squares indicating failure to reach statistical significance (p<0.05). Color bar indicates Spearman’s rho.

