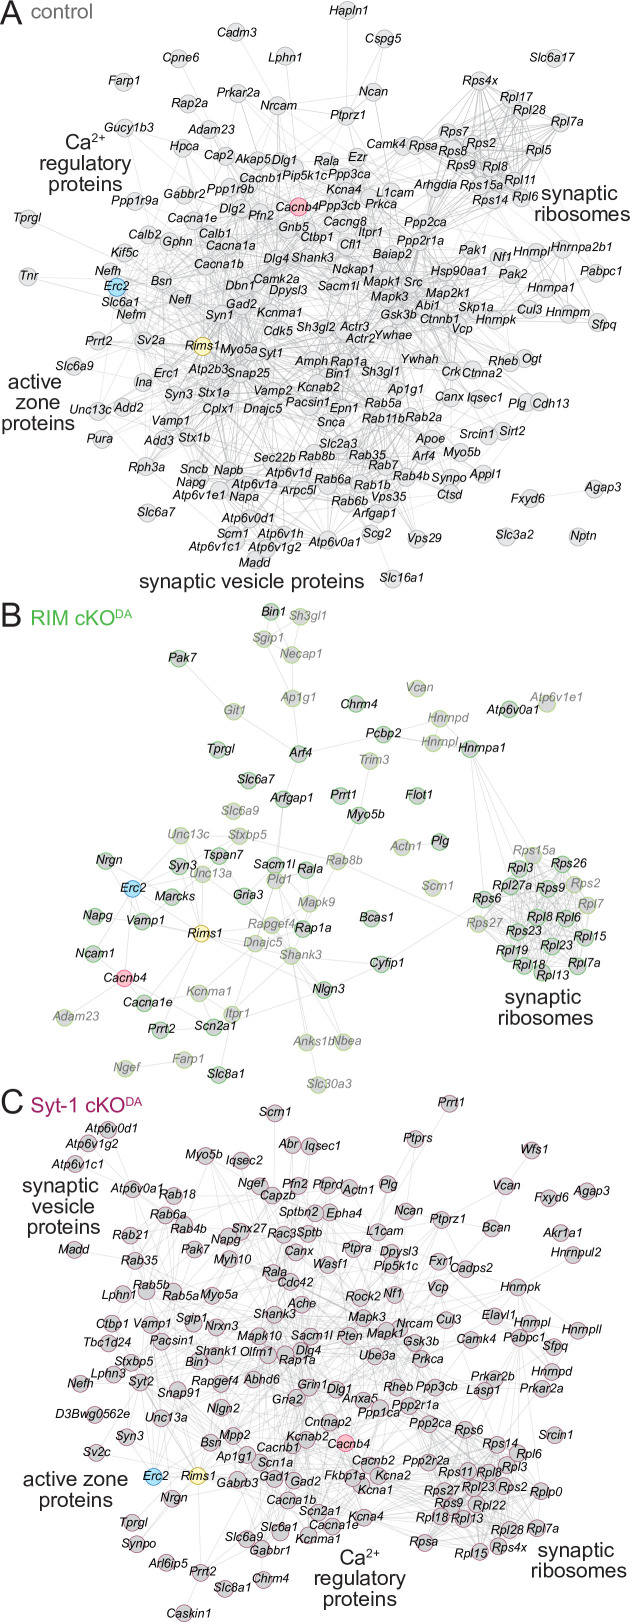
Figure 5. STRING diagrams illustrate functional categories of release site proteins and their disruption in RIM cKODA mice.
(A) STRING diagram of the enriched proteins that have a synaptic SynGO annotation in the control dataset. Physical or functional interactions determined by either empirical data or predictive modeling are illustrated as lines between proteins (Snel et al., 2000; Szklarczyk et al., 2019). The BirA bait proteins are color-coded. Functional categories identified by STRING analyses are labeled close to the corresponding clusters. (B) Same as (A), but for the RIM cKODA dataset. The proteins that are enriched only in the RIMPPCP-BirA bait are shown in lighter gray. (C) Same as (A), but for the Syt-1 cKODA dataset. Number of proteins: (A) 194; (B) 79; (C) 163.

