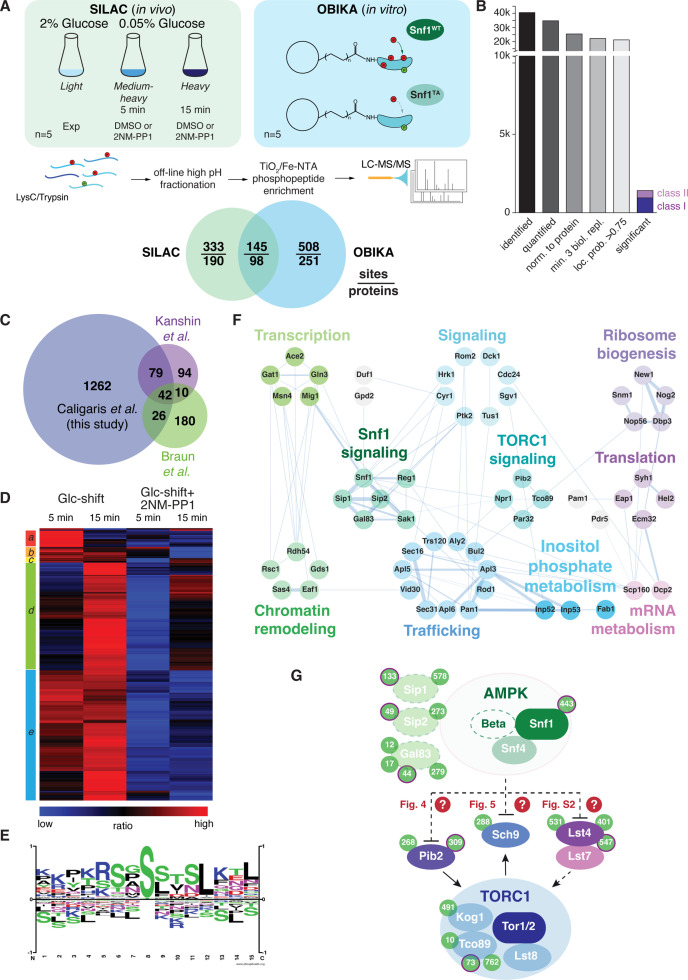
Figure 3. Quantitative phosphoproteomic analyses for the identification of potential Snf1 target sites.
(A) Quantitative MS-based proteomics workflow (SILAC n=5, OBIKA n=5). (B) Histogram of the number of identified phosphosites in the SILAC analysis after each filtering step and the relative amount of phosphosites attributed to classes I and II among the significant ones. (C) Proportional Venn diagram highlighting the commonly identified phosphosites in the current and two recent Snf1 phosphoproteomic studies. (D) Heatmap of phosphosite kinetics. Normalized SILAC ratios (treated versus untreated) of class I and class II sites (highlighted in B) were log2 transformed and z normalized prior unsupervised hierarchical clustering of the rows tree using Euclidean distance as matrix. Five major clusters a-e, each highlighted by a different color, are observed. (E) Motif analyses of Snf1 phosphosites identified by in vivo SILAC and OBIKA experiments as outlined in (A). (F) Protein-protein interaction network comprising 57 interconnected proteins out of the 98 where at least one Snf1-dependent phosphosite was shortlisted by the intersection of the SILAC and OBIKA analyses. The network was generated with Cytoscape using the STRING plugin, setting the confidence (score) cut-off at 0.25. Edge thickness represents the score value of each interaction. (G) Schematic model representing components of the Snf1/AMPK and TORC1 signaling pathways that contain Snf1-regulated phosphosites. Phosphosites attributed to class II are highlighted with a bold-pink outline. The three Snf1 β-subunits are represented with a dashed outline on the left. Solid and dashed arrows refer to direct and indirect activating interactions, respectively. Dashed lines with bars refer to potential (question marks) inhibitory interactions that are experimentally addressed in the indicated figures in this study. Source data for this figure are provided in Supplementary file 2.


