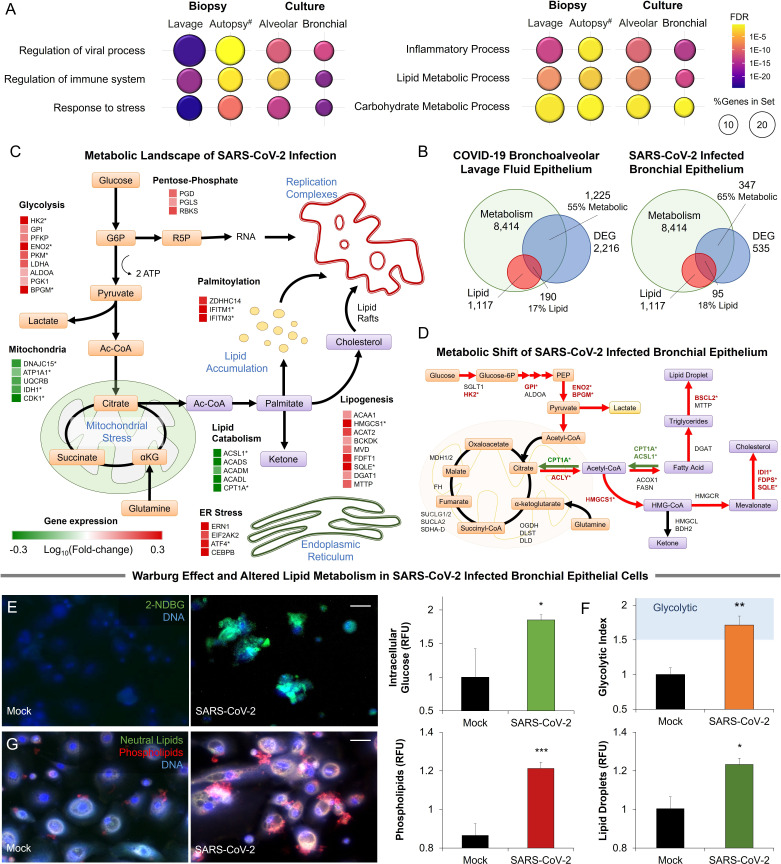
Figure 1. Metabolic fingerprint of SARS-CoV-2 infection.
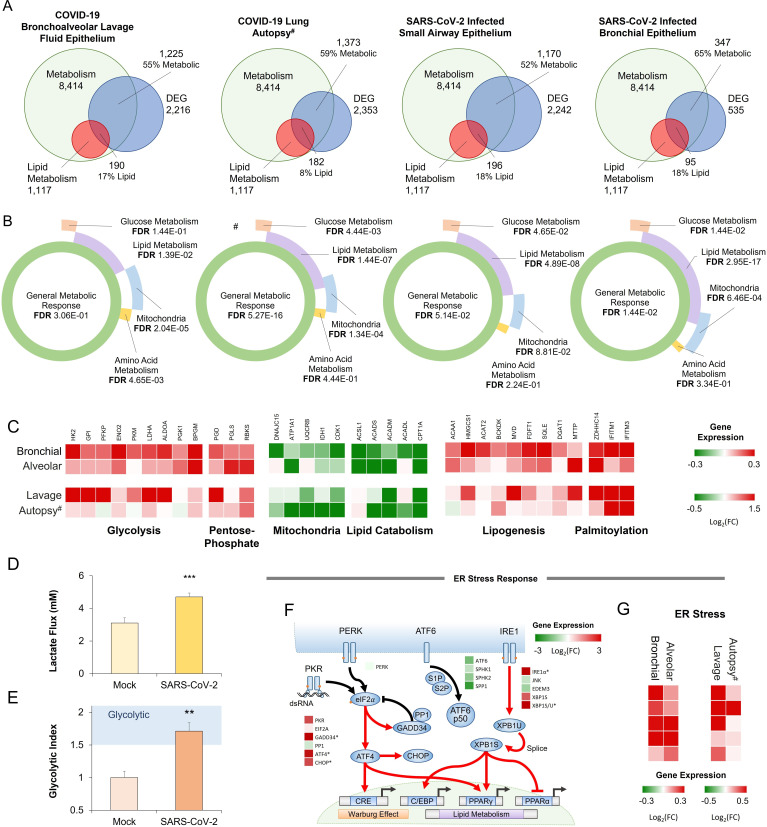
(A) Bubble plot visualization of GO terms enriched by SARS-CoV-2 infection. Epithelial cells were isolated by bronchoalveolar lavage from 6 severe COVID-19 patients compared to 4 healthy patients (lavage). Post-mortem lung biopsies from 2 severe COVID-19 patients compared to surgical biopsies from 2 non-COVID patients (autopsy). Culture sample groups include primary small airway epithelial cells (n=3; alveoli) and primary bronchial epithelial cells (n=3; bronchial) infected with SARS-CoV-2. Enrichment analysis shows immunoinflammatory response, cellular stress (FDR <10–22), and lipid metabolism (FDR <10–5). (B) Venn diagram describing the relationship between differentially expressed genes (DEG), metabolic genes (GO:0008152), and lipid metabolism genes (GO:0006629) in SARS-CoV-2 infection of primary bronchial epithelial cells and COVID-19 patient samples. Across all four sample groups 58 ± 3% of the differentially expressed genes were metabolism-related, with 15 ± 2% of the genes associated with lipid metabolism. (C) Schematic depicting the metabolic landscape of SARS-CoV-2 infection superimposed with a heat map of pathway-associated genes. Red and green boxes indicate gene expression changes following infection in primary bronchial epithelial cells. * marks differentially regulated genes (n=3, FDR <0.05). (D) Schematic of central carbon metabolism and lipid metabolism fluxes superimposed with flux-associated genes. Differentially expressed genes (n=3, FDR <0.01) are marked with *. Genes and associated fluxes are highlighted in red or green for up- or down-regulation, respectively. (E) Microscopic evaluation of primary bronchial epithelial cells infected with SARS-CoV-2 virus or mock control shows an 85% increase in the intracellular accumulation of fluorescent glucose analog (n=3). (F) The ratio of lactate production to glucose uptake (glycolytic index) in SARS-CoV-2 and mock-infected primary cells. Index increases from 1.0 to 1.7 out of 2.0 indicating a transition to glycolysis (i.e. Warburg effect). (G) Microscopic evaluation of primary bronchial epithelial cells infected with SARS-CoV-2 virus or mock control. Neutral lipids (triglycerides) are dyed green while phospholipids are dyed red. Image analysis shows a 23% increase in triglycerides (n=3, p<0.05) and a 41% increase in phospholipids (n=3, p<0.001) following SARS-CoV-2 infection indicating abnormal lipid accumulation in lung epithelium. * p<0.05, ** p<0.01, *** p<0.001.# indicates a small sample size. Bar = 20 µm. Error bars indicate S.E.M.


