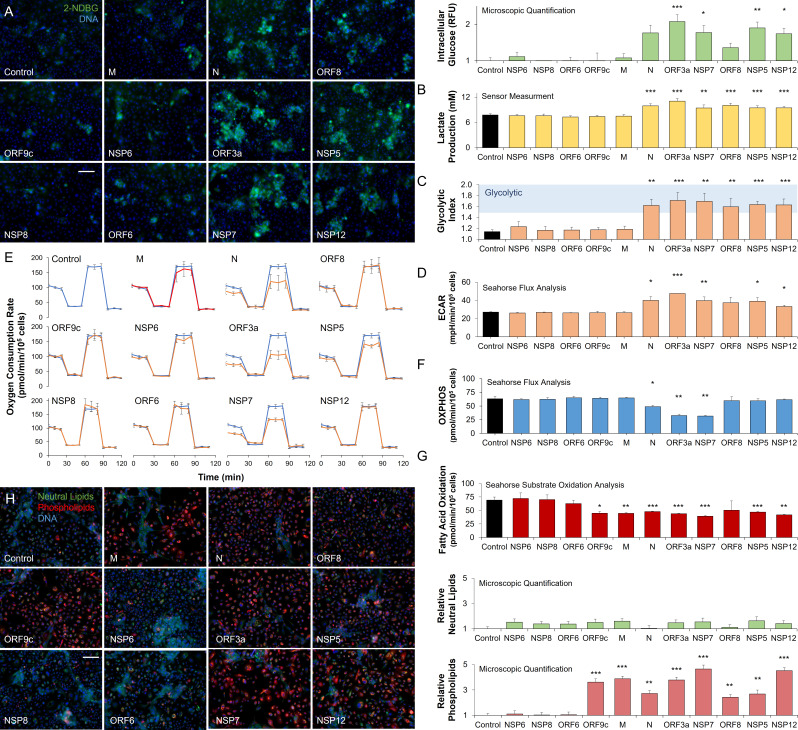
Figure 2. SARS-CoV-2 proteins modulate host metabolic pathways.
Analysis of primary bronchial epithelial cells expressing different SARS-CoV-2 proteins for 72 hr using multiple independent assays. (A) Microscopic analysis shows an increased abundance of fluorescent glucose analog (2-NDBG) by a small set of viral proteins. Quantification shows a significant increase in intracellular glucose in bronchial cells expressing N, ORF3a, NSP7, ORF8, NSP5, and NSP12 (n=6, p<0.05). (B) Direct sensor measurement of lactate production of bronchial epithelial cells shows significantly higher lactate production (n=6, p<0.01) in cells expressing the abovementioned protein subset. (C) The ratio of lactate production to glucose uptake (glycolytic index) in bronchial cells expressing viral proteins. Index significantly increases from 1.1 to 1.7 marking a shift to glycolysis (n=6, p<0.01) induced by the viral proteins. (D) Seahorse analysis of extracellular acidification rate (ECAR) surrogate measurement for lactate production, shows independent confirmation of increased glycolysis (n=6). (E) Seahorse mitochondrial stress analysis of bronchial cells expressing the viral proteins. Oxygen consumption rate (OCR) is shown as a function of time. Oligomycin, FCCP, and antimycin/rotenone were injected at 25, 55, and 85 min, respectively. Orange lines indicate viral protein-expressing cells (n=6). (F) Quantification of oxidative phosphorylation (OXPHOS) shows a decrease of mitochondrial function following expression of N, ORF3a, and NSP7 (n=6, p<0.05). (G) Seahorse XF long-chain fatty acid oxidation stress analysis, a surrogate measurement for lipid catabolism, shows virus protein-induced significant decrease in lipid catabolism by ORF9c, M, N, ORF3a, NSP7, ORF8, NSP5, and NSP12 (n=4, p<0.05). (H) Microscopic analysis of triglycerides (neutral lipids) and phospholipids shows a virus protein-induced perinuclear lipid accumulation. Quantification shows a significant accumulation of phospholipids in cells expressing the same panel of viral proteins that induced lipid catabolism inhibition (n=6, p<0.01). * p<0.05, ** p<0.01, *** p<0.001 in a two-sided heteroscedastic student’s t-test against control. Bar = 50 µm. Error bars indicate S.E.M.


