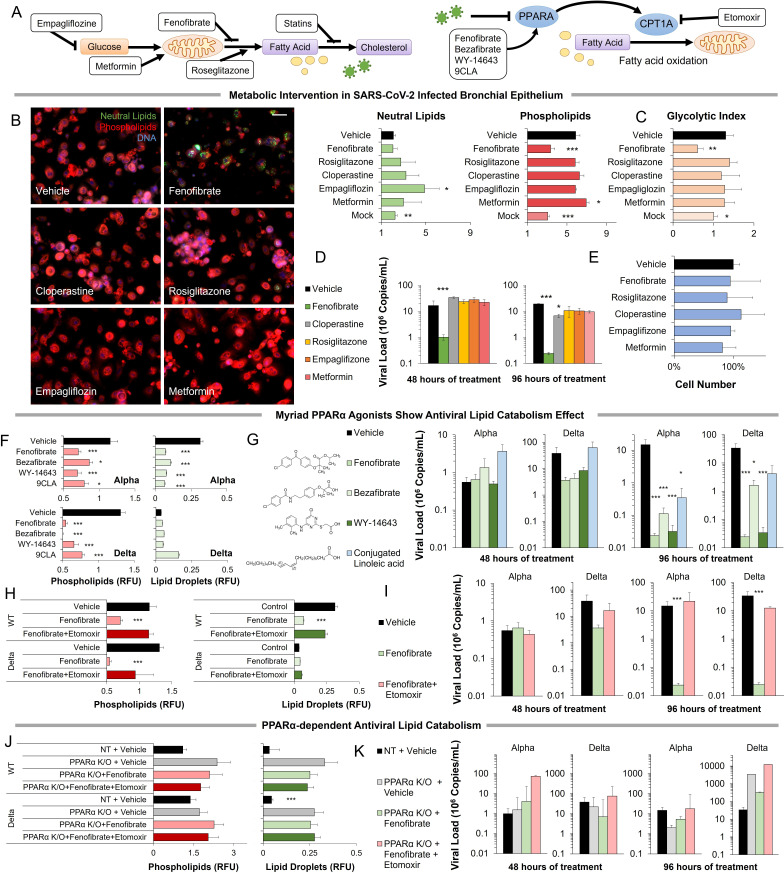
Figure 3. Metabolic intervention of SARS-CoV-2 shows the antiviral effect of PPARα activation.
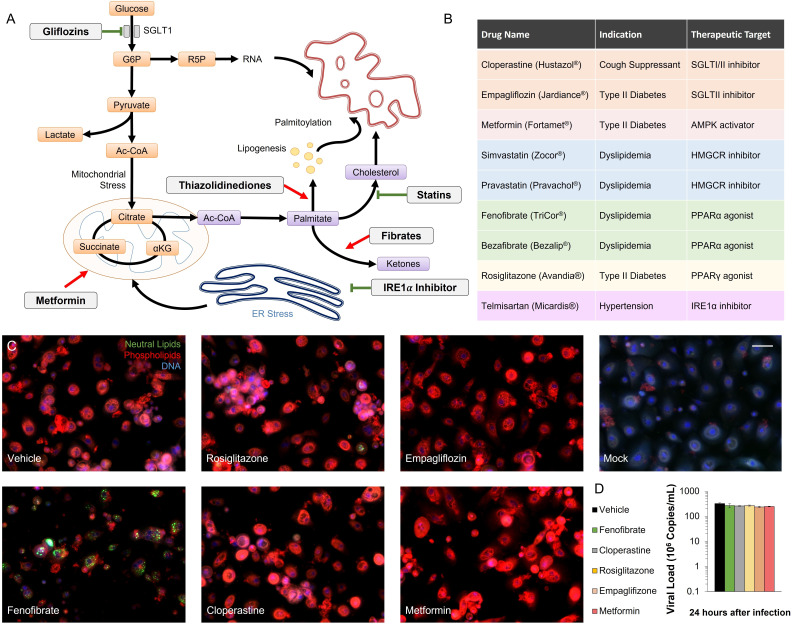
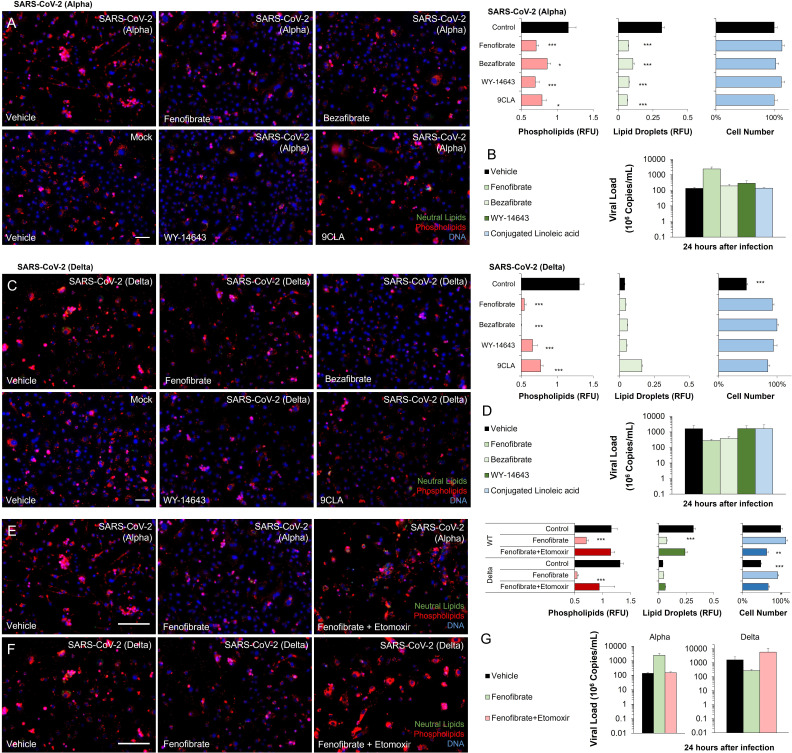
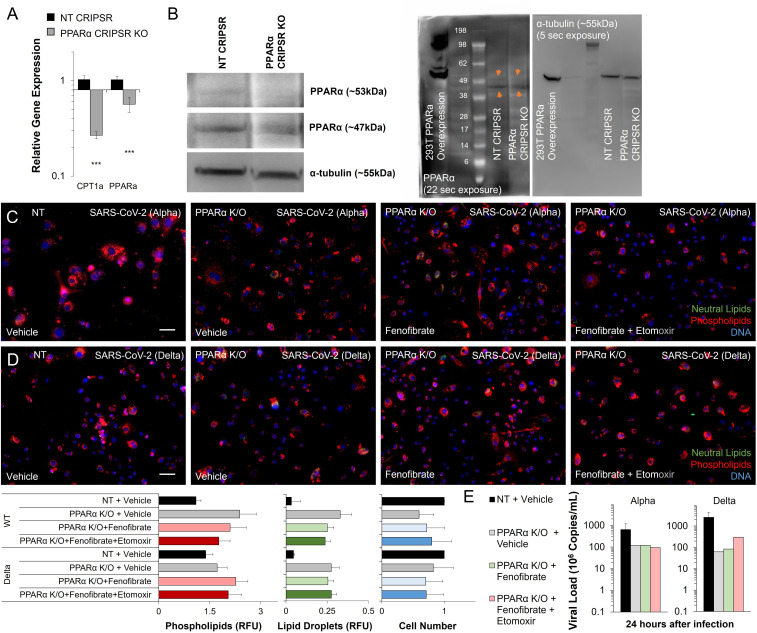
(A) Left: Schematic depicting potential drug interactions with the metabolic landscape of SARS-CoV-2 infection. Right: Schematic of the relationship between PPARα and fatty acid oxidation in our model. (B) Microscopic analysis of lipid accumulation in lung cells infected by SARS-CoV-2 (USA-WA1/2020) at MOI 2 exposed to different drugs for 96 hr compared to DMSO-treated (vehicle) and mock-infected controls. Cells treated with PPARα agonist fenofibrate showed a significant decrease in phospholipid content (n=3, p<0.001). (C) Lactate over glucose ratio of SARS-CoV-2 infected primary lung cells treated with various drugs. Fenofibrate significantly reduced the lactate-to-glucose ratio by 60% (n=3; p<0.01) normalizing the metabolic shift induced by infection. (D) Quantification of SARS-CoV-2 viral RNA over treatment with a physiological concentration of various drugs or DMSO (vehicle). Treatment with 20 µM fenofibrate (Cmax) reduced SARS-CoV-2 viral load by 2-logs (n=3; p<0.001). Treatment with 10 µM cloperastine reduced viral load by 2.5–3-fold (n=3; p<0.05). (E) Cell number post-treatment was unaffected by all drugs tested. (n=3). (F) Microscopic analysis of lipid accumulation in lung cells infected by SARS-CoV-2 (hCoV-19/Israel/CVL-45526-NGS/2020) and B.1.617.2 variant of concern (hCoV-19/Israel/CVL-12806/2021) exposed to structurally different PPARα agonists for 5 days compared to DMSO-treated cells (vehicle). Cells treated with any PPARα agonists showed a significant decrease in phospholipid content in both viruses (n=6, p<0.001). (G) Quantification of SARS-CoV-2 viral RNA over treatment with a physiological concentration of various PPARα agonists or DMSO (vehicle). Treatment with 20 µM fenofibrate, 50 µM bezafibrate, or 1 µM WY-14643 reduced SARS-CoV-2 viral load by 3–5-logs (n=6; p<0.001). Treatment with 50 µM conjugated (9Z,11E)-linoleic acid and 50 µM oleic acid reduced viral load by 2.5-logs (n=6; p<0.01 in alpha variant). (H) Microscopic analysis of lipid accumulation in lung cells infected by SARS-CoV-2 and B.1.617.2 variant of concern (delta) exposed to PPARα agonist fenofibrate with 4 µM of lipid catabolism inhibitor, etomoxir (ETO) for 5 days compared to DMSO-treated (vehicle). Cells treated with fenofibrate showed a significant decrease in phospholipid content in both viruses (n=6, p<0.001). Phospholipid decrease was reversed by the addition of etomoxir. (I) Quantification of SARS-CoV-2 viral RNA exposed to the PPARα agonist fenofibrate with or without 4 µM of lipid catabolism inhibitor, etomoxir, or DMSO (vehicle). Treatment with 20 µM fenofibrate reduced SARS-CoV-2 viral load by 4–5-logs (n=6; p<0.001). Fenofibrate antiviral effect was reversed by the addition of etomoxir. (J) Microscopic analysis of lipid accumulation in PPARα or NT CRISPR-knockout lung cells (methods) infected by SARS-CoV-2 and B.1.617.2 variant of concern (delta) exposed to PPARα agonist fenofibrate with 4 µM of lipid catabolism inhibitor, etomoxir compared to DMSO-treated (vehicle). PPARα or NT CRISPR-knockout cells treated with fenofibrate did not show a decrease in phospholipid content in either virus and was unaffected by etomoxir (n=6). (K) Quantification of SARS-CoV-2 viral RNA after treatment with the PPARα agonist fenofibrate with or without 4 µM of lipid catabolism inhibitor, etomoxir, or DMSO (vehicle). Genetic inhibition of PPARα causes cells to be refractory to fenofibrate treatment and the addition of etomoxir (n=6). * p<0.05, ** p<0.01, *** p<0.001 in a two-sided heteroscedastic student’s t-test against control. Bar = 30 µm. Error bars indicate S.E.M.


