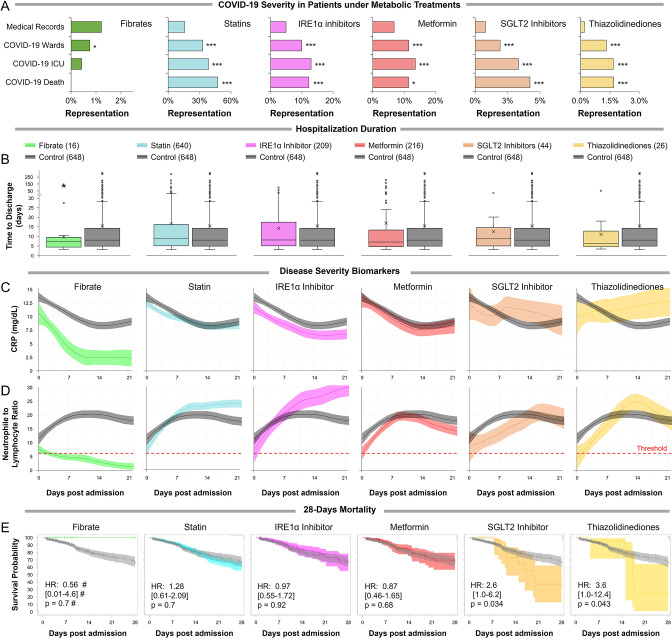
Figure 4. Observational study shows differential immunoinflammatory response to metabolic intervention.
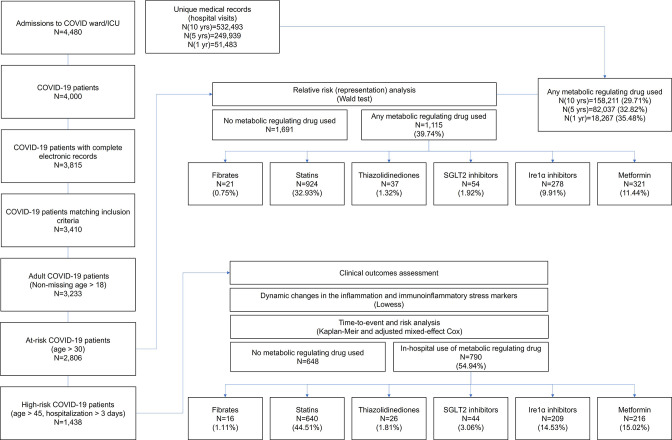
(A) Comparative representation of Israeli patients above the age of 30 taking different metabolic regulators. 532,493 unique general hospital medical records were compared with 2806 confirmed COVID-19 patients. COVID-19 patients treated with metabolic regulators were older and had a higher prevalence of chronic medical conditions and risk factors than other COVID-19 patients (Supplementary file 2). Patients taking thiazolidinediones (n=37; p<0.001), metformin (n=321; p<0.01), SGLT2 inhibitors (n=54; p<0.001), statins (n=924; p<0.001), or telmisartan (IRE1α inhibitor; n=278; p<0.001) were over-represented across all severity indicators (Supplementary file 2). Patients taking fibrates (n=21) were significantly underrepresented in hospital admissions (p=0.02) and were not over-represented in other severity indicators. * p<0.05, ** p<0.01, *** p<0.001 in a Wald test compared to the proportion of these drug users in medical records. Error bars indicate S.E.M. (B) Box and whisker plot of length of hospitalization in treatment and non-treatment groups (Control). Israeli patients taking bezafibrate or ciprofibrate (fibrates) were associated with significantly lower hospitalization duration (p=0.03). The numbers in parentheses indicate the number of patients. (C–D) Dynamic changes in the inflammation marker CRP and neutrophil-to-lymphocyte ratio (NLR) marking immunoinflammatory stress in treatment and non-treatment groups (Control) during 21-day hospitalization. The centerline shows the mean value while the 95% confidence interval is represented by the shaded region. (C) CRP levels gradually declined in the control group reaching a plateau by day 14 post-hospitalization. The fibrates group showed a significantly faster decline in inflammation, while the thiazolidinedione group showed marked elevation in CRP level above control. (D) NLR rose in the control group above normal values (dotted red line) stabilizing after 7–14 days and then declining as recovery begins. The fibrates group showed only mild stress, and maintain normal levels of NLR throughout hospitalization. Patients taking statins or IRE inhibitors showed elevated NLR post-day 10 of hospitalization. (E) Kaplan–Meier survival curves of 28 day in-hospital mortality for treatment and non-treatment groups (Control). The small group of patients taking fibrates did not report any deaths, while thiazolidinedione and SGLT2 inhibitor users had a significantly higher risk of mortality (HR: 3.6, 2.5; p=0.04, 0.03 respectively, Supplementary file 2). * p<0.05, ** p<0.01, *** p<0.001. In boxplots, x is the mean; center line is the median; box limits are 25th and 75th percentiles; whiskers extend to 1.5×the interquartile range (IQR) from the 25th and 75th percentiles; dots are outliers. # indicates that the hazard ratios were calculated using Firth’s correction for monotone likelihood with profile likelihood confidence limits.


