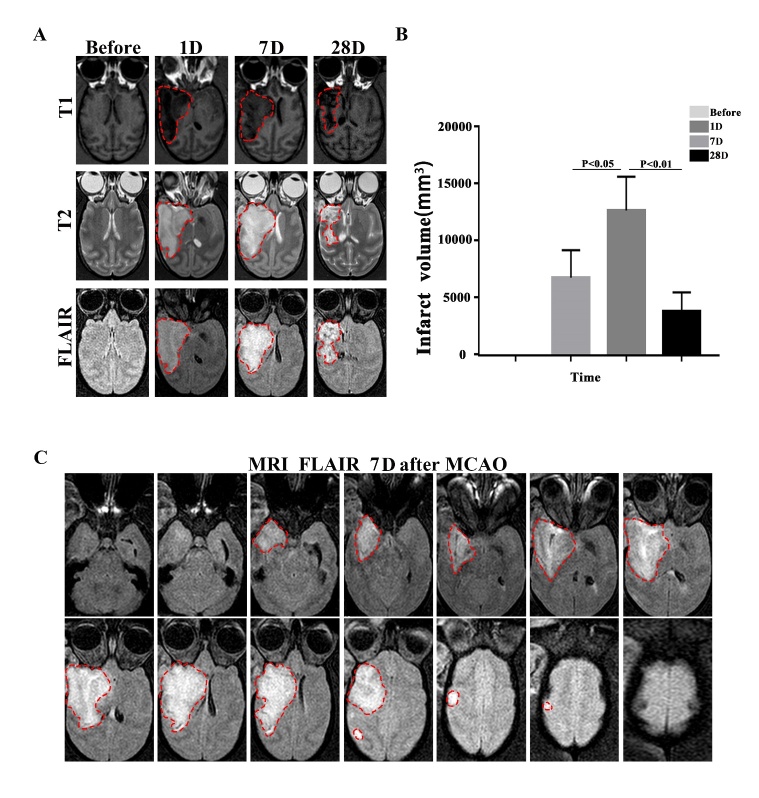
Figure 2.
The infarct volume assessed by means of MRI in MCAO cynomolgus monkeys. (A) The brain lesions (highlighted area) were detected by MRI at different time points after M1 MCAO. (B) Quantification of the infarct volume. Cortical infarct volume is calculated based on FLAIR after surgery by image J. One-way ANOVA (**P<0.01, *P<0.05, n=3). (C) A representative image showing FLAIR sequence at 7 days after FeCl3-induced MCAO in cynomolgus monkeys. The highlighted area in white is the high signal area under the FLAIR sequence.

