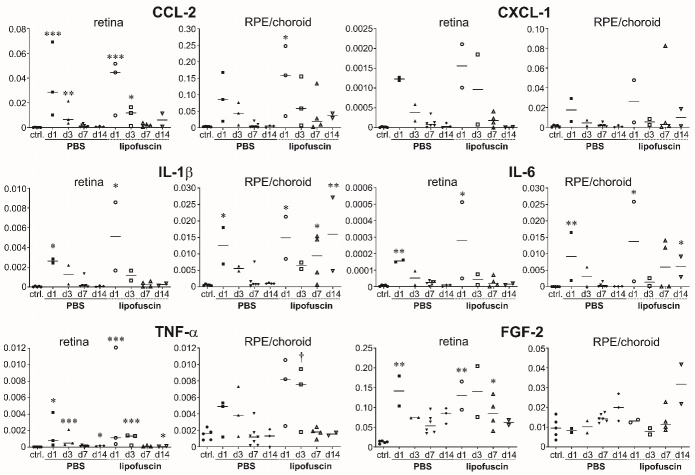
Figure 16.
Levels of mRNA of inflammatory cytokines are increased after injections. Results of quantitative PCR of different inflammatory cytokines (CCL-2, CXCL-1, IL-1β, IL-6, TNF-α) and the growth factor FGF-2 as indicated above the diagrams in the non-treated eye (control) and 1, 3, 7 and 14 days after subretinal injection of PBS or LF. Retina and RPE/choroid complex were analysed separately. Between 2 and 6 samples were analysed per time point. In the dot blots, horizontal lines represent the median values of the data. Note the different scales. Significance of differences between controls and treated eyes are shown by asterisks: * p<0.05, ** p<0.01, *** p<0.001, with p values calculated by the Kruskal-Wallis test with Dunn's multiple comparisons test. † shows significant difference between injection of PBS and injection of LF (p<0.05).

