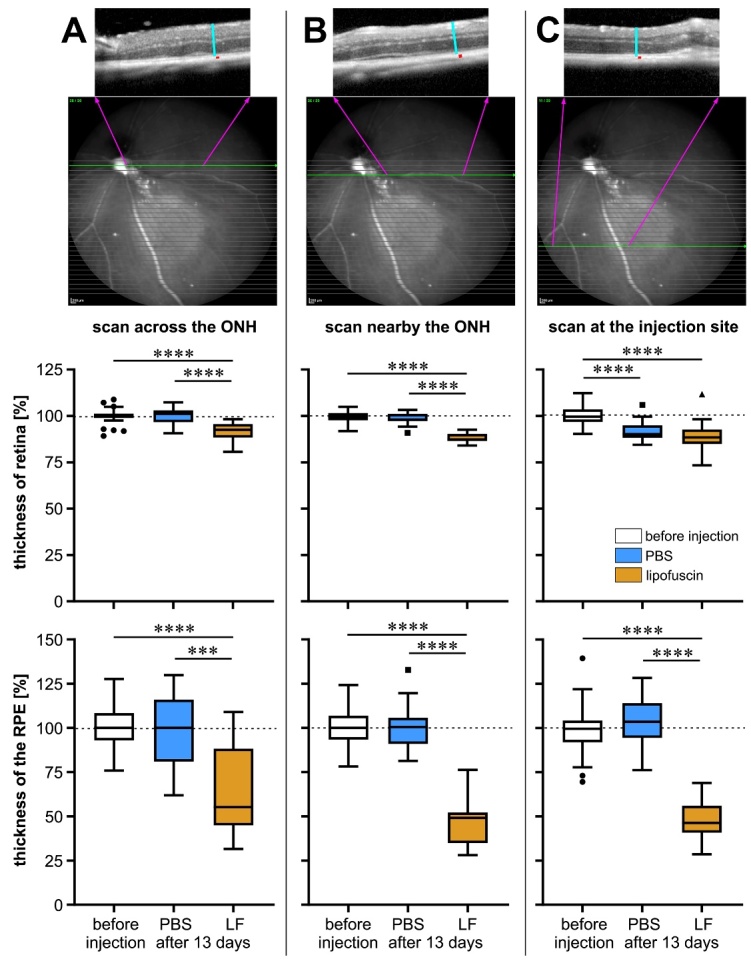
Figure 4.

Measurement of retinal thickness and RPE layer thickness in mouse eyes. Measurement was performed before injection (n=43) and 13 days after injection of PBS (n=13) or LF (n=22) in OCT scans recorded at three different sites in each eye: (A) across the optic nerve head (ONH), (B) nearby the ONH, and (C) at the injection site. Values were determined as indicated on top, where turquois lines indicate retinal thickness and red dots RPE layer thickness. Data are presented as box plots after Tukey, and significance of differences is indicated by *** p<0.001 and **** p<0.0001, with p values calculated by the Kruskal-Wallis test with Dunn's multiple comparisons test.
