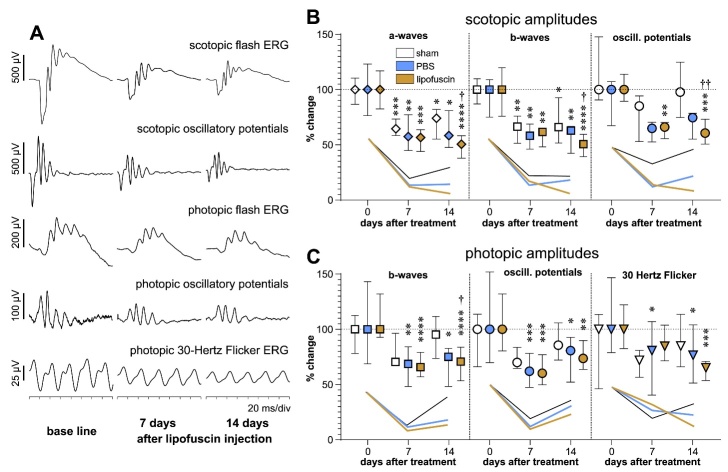
Figure 5.
Functional testing by electroretinography. (A) Typical ERG waveforms obtained in the mice by different techniques indicated above the curves. In the example, results of ERG measurements are shown before injection and 7 days and 14 days after a subretinal injection of LF. (B) Changes of amplitudes of scotopic parameters and (C) changes of amplitudes of photopic parameters compared to baseline 7 days and 14 days after sham treatment (white symbols) or injection of PBS (blue symbols) or LF (dark yellow symbols). Median values with interquartile ranges are shown. Numbers of animals for sham, PBS and LF groups were before treatment n=6, n=14 and n=11, 7 days after injection n=6, n=7 and n=8, and 14 days after injection: n=5, n=8 and n=8, respectively. Symbols show amplitudes of different ERG parameters: ⋄ a-waves, ▯ b-waves, ◯ oscillatory potentials, ▽ 30 Hertz Flicker. Asterisks show statistical significance of differences compared to corresponding base line values: * p<0.05, ** p<0.01, *** p<0.001, **** p<0.0001, with p values calculated by the Kruskal-Wallis test with Dunn's multiple comparisons test. Crosses indicate significance of differences compared to corresponding values after sham treatment: † p<0.05, †† p<0.01.

