
FIGURE 4.
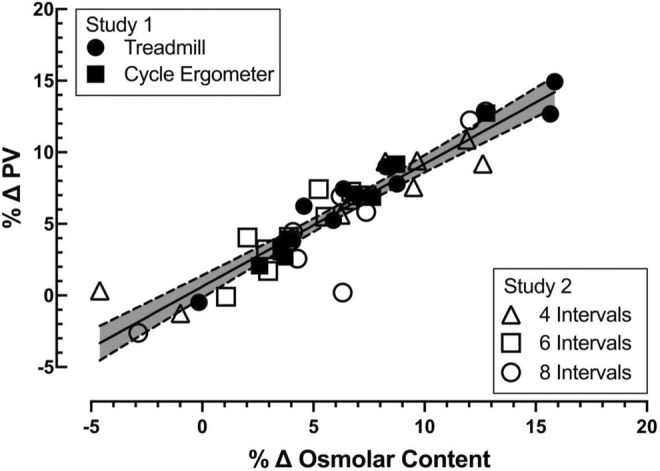
Relationship between the percent change in plasma volume 24 h following exercise and the percent change in estimated plasma osmolar content. Individual data for each subject for each exercise mode and each subject for the three exercise volumes performed. Best‐fit line by least squares linear regression, shading between the dotted lines represents the 95% confidence interval. All groups combined (shown), r = 0.9303, p < 0.0001; n = 45, 16 females, 19 males.