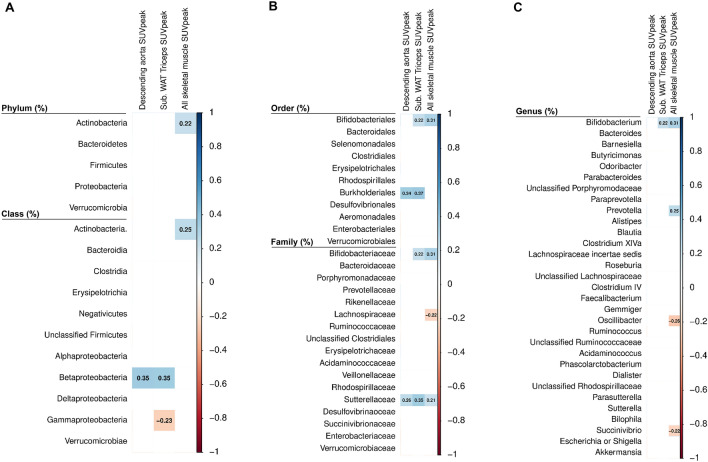
Fig. 3.
Partial Spearman correlation of fecal microbiota composition with tissues related to 18F-FDG uptake adjusted for the PET/CT scan date. Boxes only represent the statistically significant (P < 0.05) correlations and the value within the boxes shows the partial Spearman correlation coefficient. Blue boxes indicate a positive correlation whereas red boxes indicate a negative correlation between fecal microbiota composition with tissues related 18F-FDG uptake adjusted for PET/CT scan date. Panel A shows phylum and class taxonomic levels. Panel B indicates order and family taxonomic levels, and panel C shows genus taxonomic level. All SUV variables are shown relative to lean body mass. 18F-FDG [18F]fluorodeoxyglucose, PET/CT positron emission tomography/computed tomography, SUV standardized uptake value, WAT white adipose tissue

