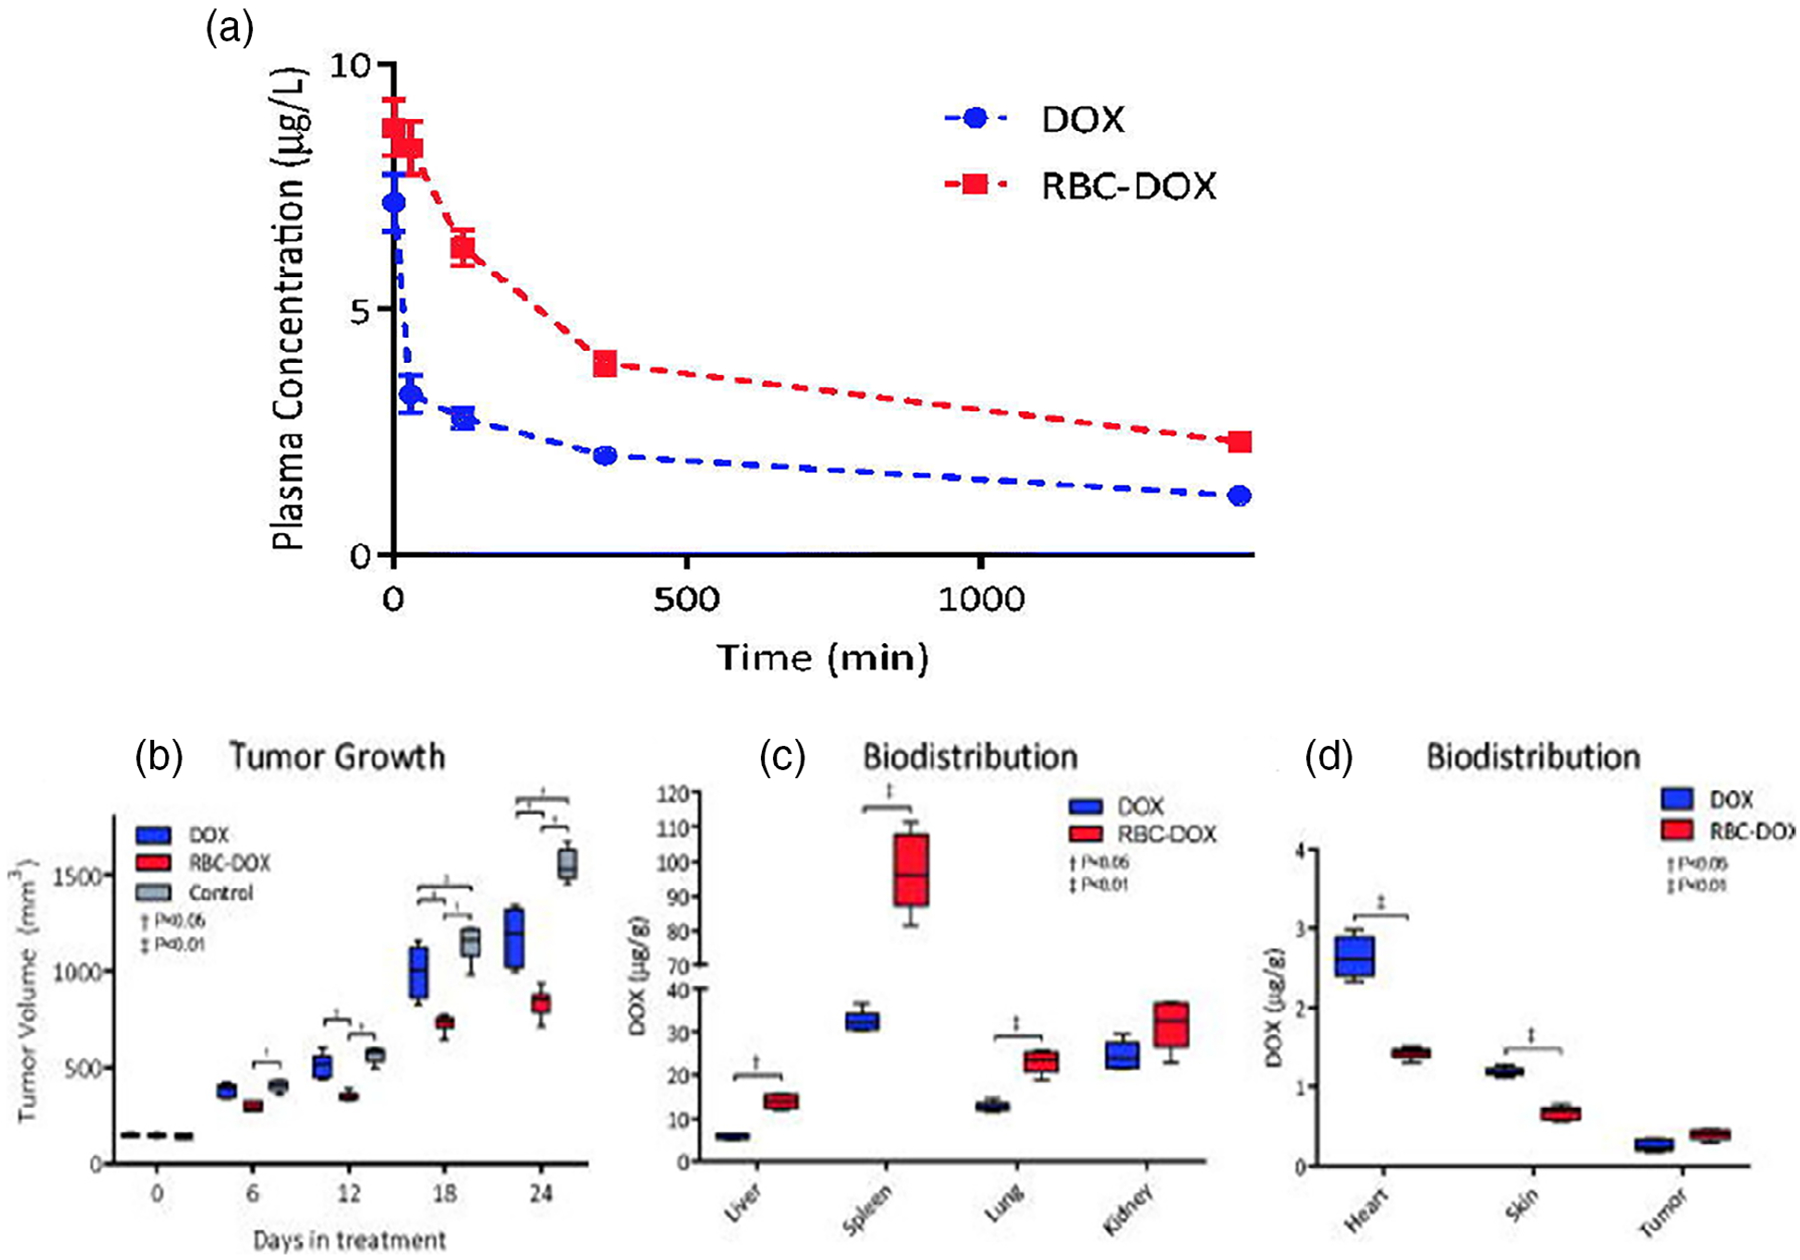
FIGURE 6.

(a) Plasma concentration–time plot over a 24 h period of DOX after a 5 mg/kg intravenous injection in DOX and RBC-DOX groups. (b) Tumor growth over a 24-day period for control (gray), DOX (blue), and RBC-DOX (red) in treated mice. (c) Biodistribution of DOX in liver, spleen, lungs, and kidney. (d) Biodistribution of DOX in heart, skin, and tumor-treated mice after the 24-day treatment period (Lucas et al., 2019)
