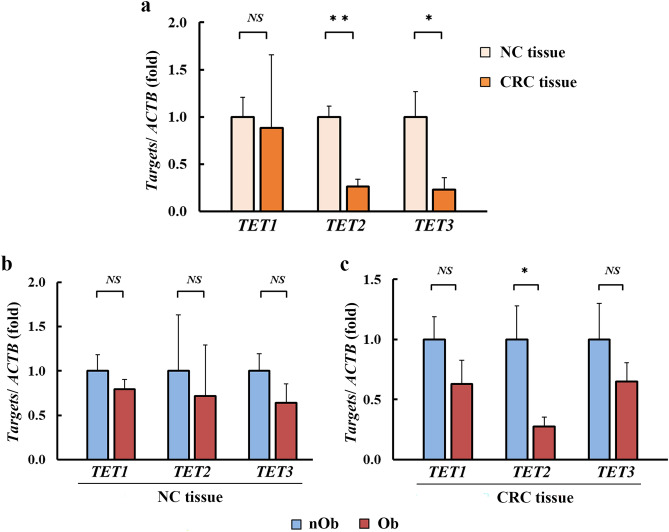
Figure 4.
Expression analysis of TET1 to 3 using RT-qPCR. Expression levels of TET2 (0.26-fold, p < 0.01) and TET3 (0.23-fold, p = 0.03) were significantly lower in CRC tissues, when compared to that in NC tissues (a), whereas no significant difference was observed in TET1 expression (p = 0.89). In the NC tissue (b), no significant differences were detected in the expression levels of TET1 (p = 0.72), TET 2 (p = 0.21), and TET 3 (p = 0.37). In CRC tissue (c), there was a lower expression of TET2 in Ob-CRC, compared to that in the nOb-CRC group (0.27-fold, p = 0.04). *p < 0.05, **p < 0.01, NS no significant. RT-qPCR real-time quantitative polymerase chain reaction, NC adjacent noncancerous, CRC colorectal cancer, TET ten-eleven translocation, ACTB β-actin, Ob-CRC obese patients with colorectal cancer, nOb-CRC non-obese patients with colorectal cancer.

