Figure 5.
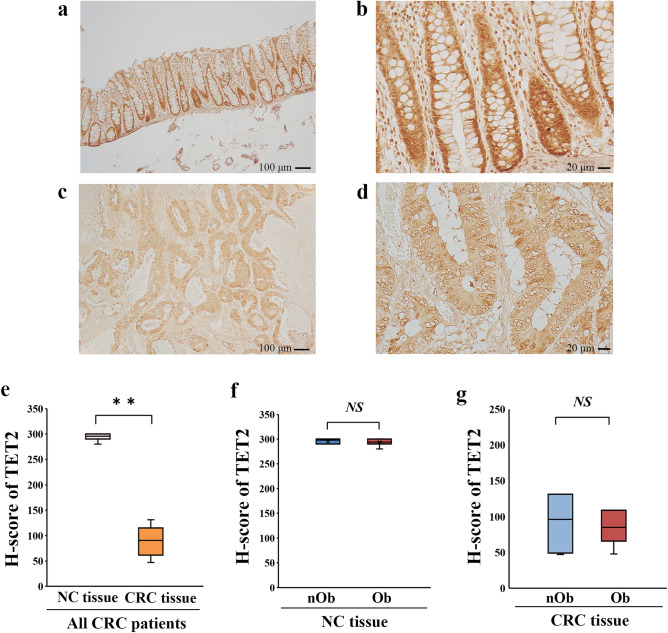
Analysis of immunohistochemical staining of TET2. Strong nuclear signals of TET2 in the NC tissues (low-power field: a, high-power field: b) and low expression of TET2 in the CRC tissues (low-power field: c, high-power field: d). Quantitative analysis of nuclear staining intensity of TET2 with H-scores indicated a decrease in the CRC tissue, when compared to that in the NC tissue (p < 0.01, e); however, no difference was detected between the Ob-CRC and nOb-CRC groups, with respect to both NC (p = 0.80, f) and CRC tissues (p = 0.80, g). The H-scores for each case were calculated from the mean scores of three individual sections. *p < 0.05; **p < 0.01; NS no significant. NC adjacent noncancerous, CRC colorectal cancer, TET ten-eleven translocation, Ob-CRC obese patients with colorectal cancer, nOb-CRC non-obese patients with colorectal cancer.

