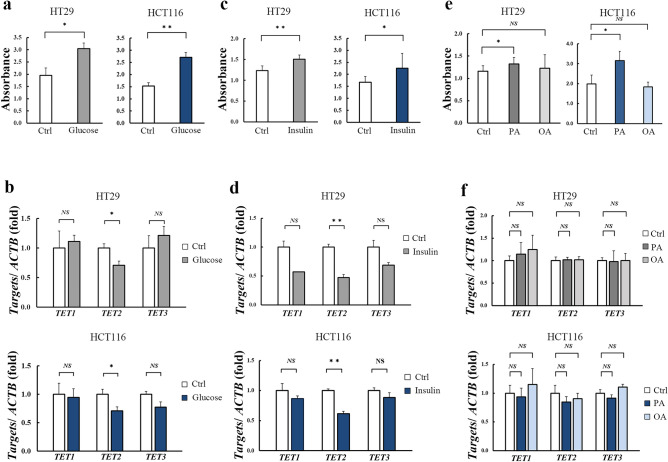
Figure 6.
Effect of metabolic factors on the proliferation and TET2 expression of human colorectal cancer cells. Treatment with 50 mM glucose-stimulated proliferation (a) and significantly decreased the expression of TET2 mRNA (b) in both HT-29 (0.71-fold, p = 0.03) and HCT116 (0.71-fold, p = 0.04) cells. Similarly, treatment with 100 nM insulin-stimulated proliferation (c) and significantly decreased the expression of TET2 mRNA (d) in both HT29 (0.47-fold, p < 0.01) and HCT116 (0.62-fold, p < 0.01). Treatment with 250 µM PA induced proliferation, while that with 250 µM OA did not induce any changes, in both cell lines (e), no significant alteration in the expression of TETs in either fatty acid treatments (f). *p < 0.05; **p < 0.01; NS no significant. TET ten-eleven translocation, Ctrl control, PA palmitic acid, OA oleic acid, ACTB β-actin.

