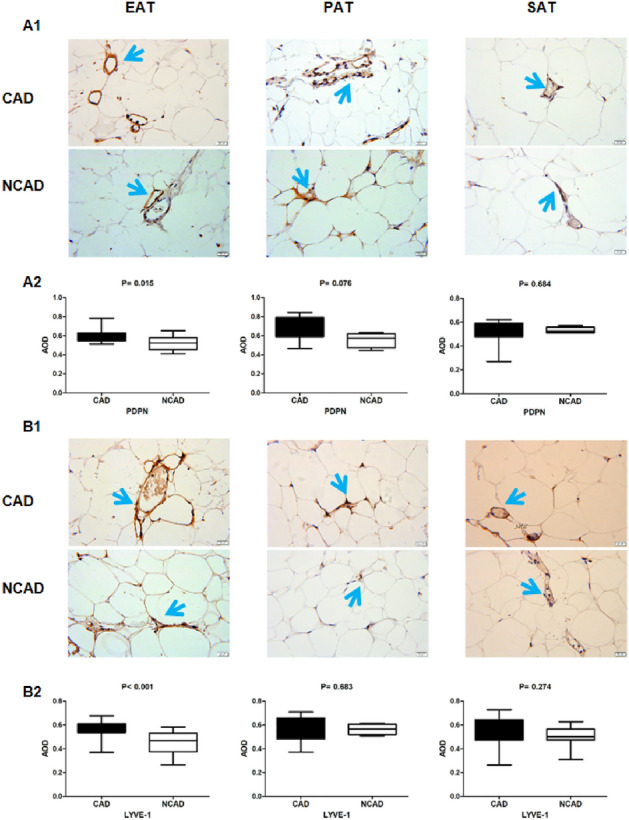
Figure 6.

Immunohistochemistry detection of PDPN and LYVE-1 expression in adipose tissues. (A1) Representative images of PDPN expression in EAT, PAT and SAT. (A2) AOD of PDPN in EAT, PAT and SAT between CAD (n = 22) and NCAD (n = 15) patients. (B1) Representative images of LYVE-1 expression in EAT, PAT and SAT. (B2) AOD of LYVE-1 in EAT, PAT and SAT (n = 22). The Mann–Whitney U test was used to compare the relationship between the CAD and NCAD groups.
