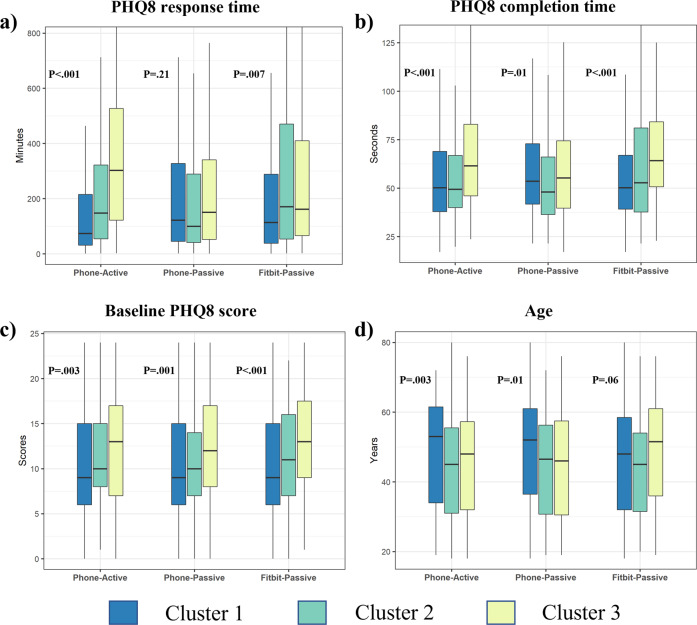
Fig. 3. Significant factors impacting the long-term engagement patterns.
Significant differences in participants’ (a) survey response time, (b) survey completion time, (c) baseline depression symptom severity, and (d) age across three long-term engagement patterns (Cluster 1, Cluster 2, and Cluster 3) for Phone-Active, Phone-Passive, and Fitbit-Passive data streams, respectively. Note: Cluster 1, Cluster 2, and Cluster 3 represent the most engaged, medium engaged, and least engaged patterns shown in Fig. 2b. The centerline of the boxplots shows the median value of the factor across participants for each cluster, the box indicates the interquartile range (IQR) from the 25th (Q1) to 75th (Q3) percentiles, and the whiskers represent points within Q1 − 1.5*IQR and Q3 + 1.5*IQR. All p values were calculated by Kruskal-Wallis tests.

