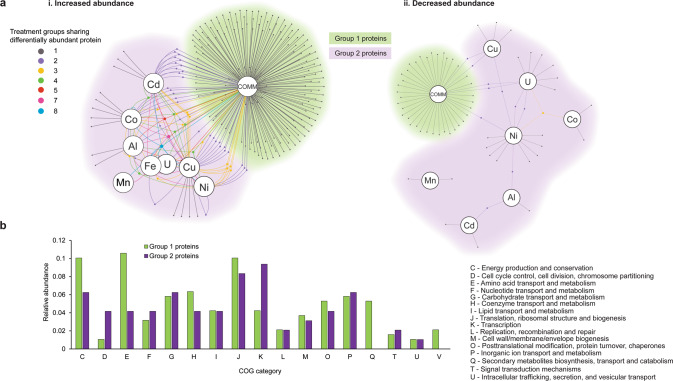
Fig. 3. Comparison of the global response of the strain CPTF proteome between metals mix and individual metal treatments.
a Network diagrams of differentially abundant proteins at 10 h of growth under anoxic nitrate-respiring conditions (n = 3 replicates). Large nodes represent the metal treatment condition. Small nodes represent individual differentially abundant proteins (relative to the untreated control). Edges indicate conditions under which the proteins are differentially abundant. Network maps display proteins that were increased (i) or (ii) decreased in abundance in response to metal treatments. Small node/edge colors (legend is shown on the image) represent the number of treatment groups sharing the differentially abundant proteins. Background cloud colors distinguish the Group 1 proteins (green: only differentially abundant in the COMM treatment) from the Group 2 proteins (purple: all other proteins). b Functional comparisons of Group 1 and Group 2 proteins using COG categories. Category S (unknown function) is excluded from the visualization for clarity. All other categories were not represented in the differentially abundant proteomes.

