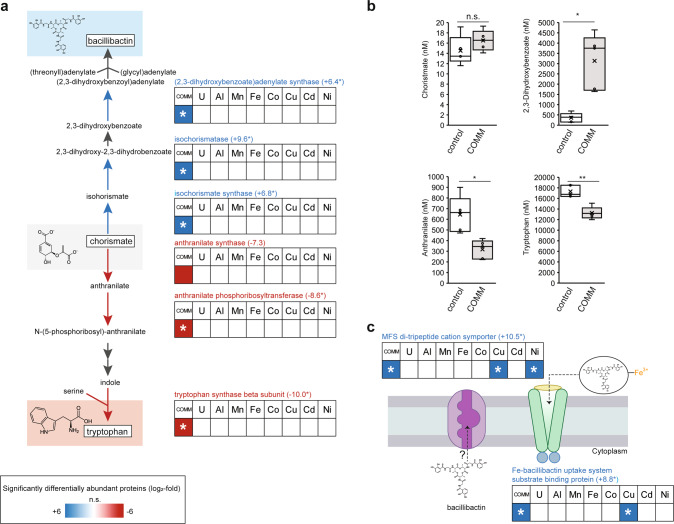
Fig. 4. COMM exposure dysregulates bacillibactin and tryptophan biosynthetic pathways.
For all panels, asterisks indicate imputed log2-fold changes due to the non-detectability of the peptide under the compared conditions. This fold-change was imputed from a quantitative value of 1000, a value ~90% of the lowest value in the dataset (LLOD). a Patterns of protein abundance across the enzymes of the bacillibactin and tryptophan biosynthetic pathway. Heat maps display average (n = 3 replicates) log2-fold abundance changes of individual proteins across the different treatment conditions relative to the control (left-to-right: COMM, U, Al, Mn, Fe, Co, Cu, Cd, Ni). Numbers in parentheses to the right of protein names indicate the specific log2-fold change of the protein in the COMM-exposed cultures. The heat map scale (displayed at log2-fold abundance changes relative to the control) is at the bottom of the image. Blue boxes indicate increased protein abundance (p < 0.05), red boxes indicate proteins that were significantly decreased in abundance (p < 0.05) and white boxes indicate no significant difference in abundance relative to the control. Pathway proteins lacking a heat map had no significant change in abundance patterns in any of the tested conditions. b Plots of intracellular concentrations of select bacillibactin/tryptophan biosynthetic pathway metabolites (n = 5 replicates). Center lines represent median values. Interquartile ranges and maximum/minimum values are represented by box ranges and whisker ranges, respectively. Mean values are indicated with an “x”. Internal points are marked with dots. * p < 0.01, ** p < 0.001. c Differential protein abundance patterns of putative bacillibactin transporters. Heat map details are the same as (a).

