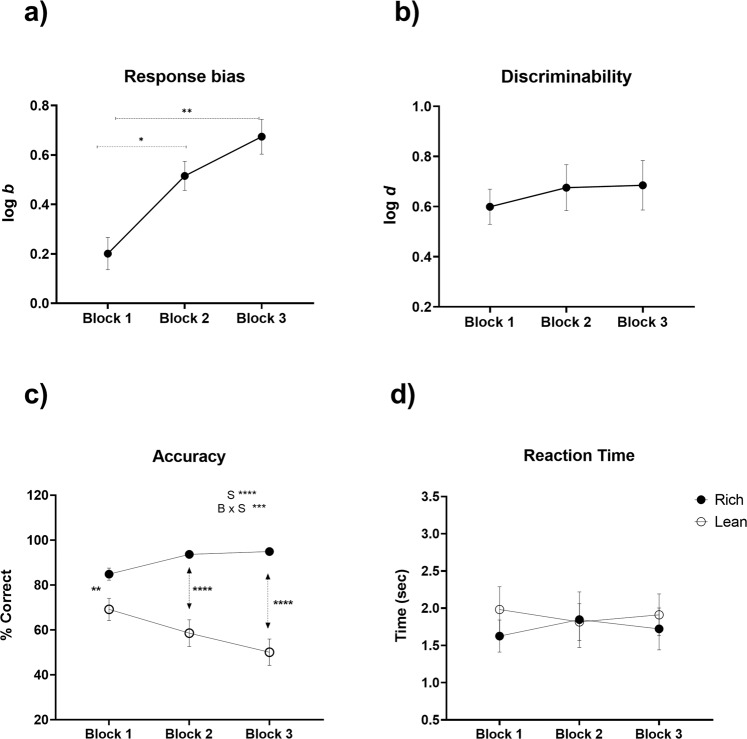
Fig. 2. Behavioral performance in the PRT.
The graphs show each variable across 3 blocks of 100 trials each. a Response bias, measured with log b, b discriminability measured with log d, c accuracy, calculated as the percentage of correct responses, and d reaction time, measured as time to make a response (seconds). Collectively, these findings indicate that the task evoked the intended preference for the stimulus paired with more frequent reward (log b and higher accuracy for the rich vs. lean stimulus), without fluctuations in task difficulty (log d) or reaction time throughout the task. Main effects and interaction are presented with letters S (Stimulus Type) and B × S (Block × Stimulus Type interaction) with asterisks according to their statistical significance. Dotted lines/arrows with asterisks show the statistical significance obtained after multiple comparisons. N = 11.

