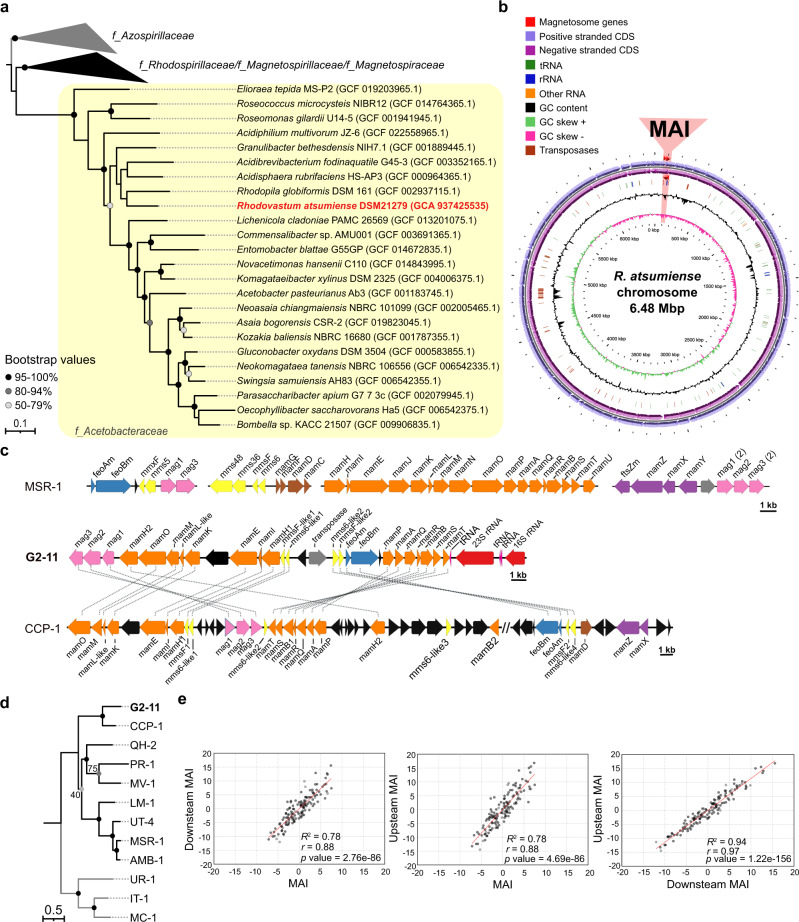
Fig. 1. Phylogeny, chromosome, and MGCs organization of G2-11.
a The maximum likelihood phylogenetic tree based on ribosomal proteins demonstrates the position of G2-11 (highlighted in red) within family Acetobacteraceae (highlighted in the yellow box). The Azospirillaceae family was used as an outgroup based on the latest Alphaproteobacteria phylogeny. Branch length represents the number of base substitutions per site. Values at nodes indicate branch support calculated from 500 replicates using non-parametric bootstrap analysis. Bootstrap values <50% are not shown. The families are labeled according to GTDB taxonomy. b Circular map of the G2-11 chromosome. The region of magnetosome genomic island (MAI) is highlighted in red. c Organization of the G2-11 MGCs in comparison to MSR-1 and the uncultivated MTB CCP-1. Magnetosome genes are colored according to their position within the magnetosome operons of MSR-1. Connecting dotted lines indicate synteny between the G2-11 genes and CCP-1. d Maximum likelihood phylogenetic tree of concatenated amino acid sequences of the shared MamKMOPAQBST proteins for G2-11 and the MTB strains: uncultivated calcium carbonate producing MTB CCP-1, Magnetospira sp. QH-2, Ca. Terasakiella magnetica PR-1, Magnetovibrio blakemorei MV-1, Ca. Magneticavibrio boulderlitore LM-1, Magnetospirillum sp. UT-4, M. gryphiswaldense MSR-1, M. magneticum AMB-1. Ca. Magnetaquicoccus inordinatus UR-1, Magnetococcus marinus MC-1, and Magnetofaba australis IT-1 were used as an outgroup. Branch length represents the number of base substitutions per site. The exact values of branch support are indicated at nodes if deviate from 100% (calculated from 500 replicates using non-parametric bootstrap analysis). e Distribution of z-normalized tetranucleotide frequencies in the G2-11 MAI region in comparison to the flanking regions (Upstream MAI and Downstream MAI). Each dot represents a tetranucleotide combination. Pearson’s r, coefficient of determination R2, and the p values are shown on the graphs.

