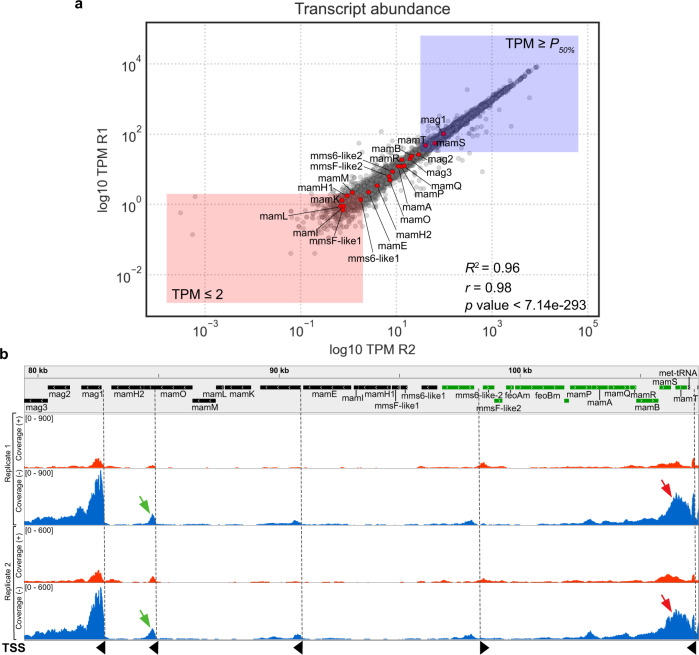
Fig. 2. Transcription of the magnetosome genes in G2-11.
a Log10 of the transcript abundances for all genes in the G2-11 genome presented as TPM (transcripts per million). Red dots represent the magnetosome genes. Red rectangle shows genes with TPM below the threshold, and blue rectangle shows genes with expression levels above median. R1 and R2: biological replicates. Pearson’s r and the p value is presented on the graph. b RNAseq coverage of reads mapped on the positive (red) and negative (blue) strands of the genome in the MAI region. The gray balk shows the gene map: genes encoded on the negative strand are colored in black, on the positive - in green. Red arrows indicate the anti-sense transcription in the mamPAQRBST operon. Green arrows indicate the intragenic TSS within mamO. TSS are indicated with dashed lines and black arrowheads that show the direction of transcription.

