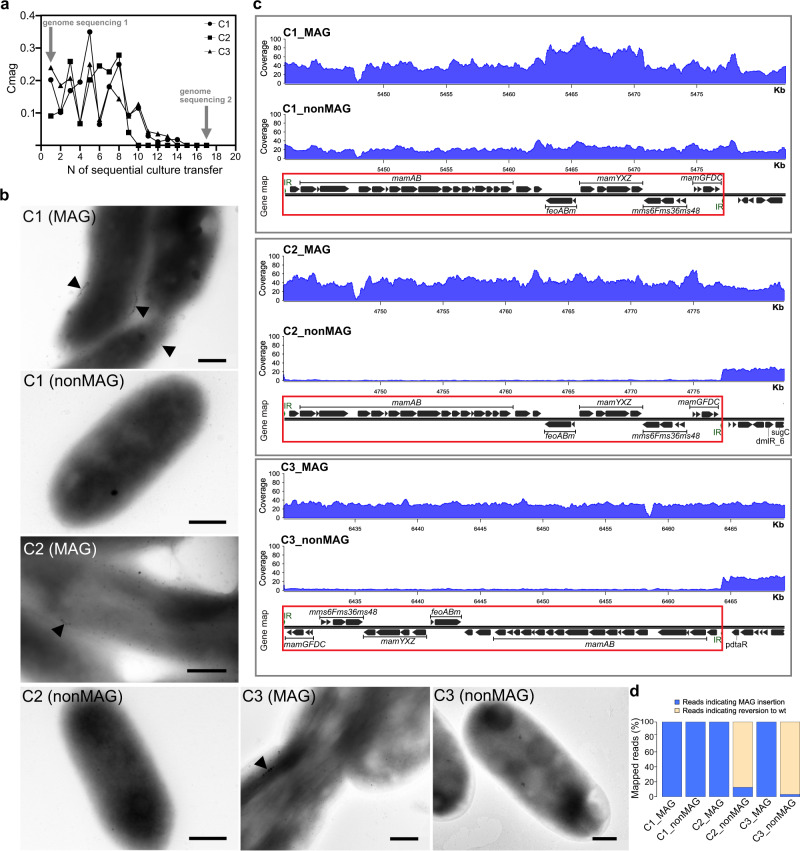
Fig. 5. Analysis of the dynamics of magnetosome biosynthesis loss in G2-11 MAG.
a Change of the magnetic response (Cmag) of three randomLy selected MAG insertion mutants with sequential culture passages. Arrows indicate the timepoints at which the genomes were re-sequenced. b TEM micrographs of the cells at timepoint 1 (MAG) and timepoint 17, after the loss of magnetosomes (nonMAG). Scale bars: 0.5 µm. c Read coverage normalized to the library size of the MAG and nonMAG mutants. The gene maps show the insertion positions of the MAG cassette (highlighted by red rectangle) within the genome. d Bar chart showing the percentage of reads indicating the MAG cassette excision and the cassette presence.

