
Figure 4. Loss of information induced by scoring too few grants in extreme categories.
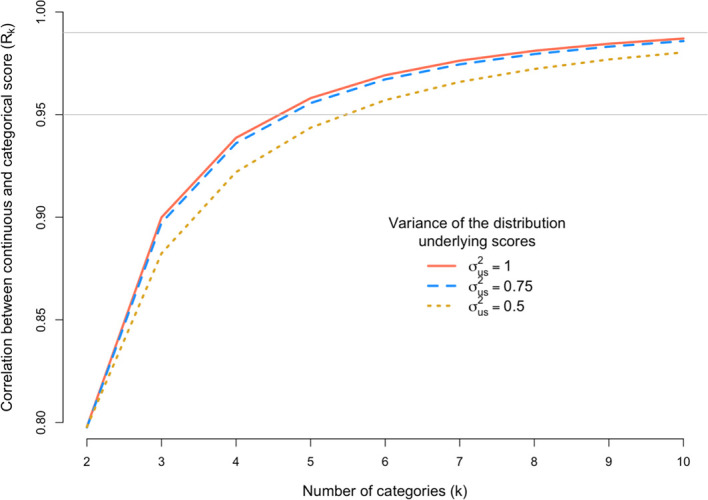
The x-axis is the number of discrete categorical scores (k) and the y-axis shows the correlation (R k) between the observed categorical score (Y) and the underlying continuous score (u). The correlation R k is calculated under three scenarios defined by the variance (σ 2 s) of the distribution of underlying scores. The grey horizontal line denotes a correlation of 0.95 or 0.99.