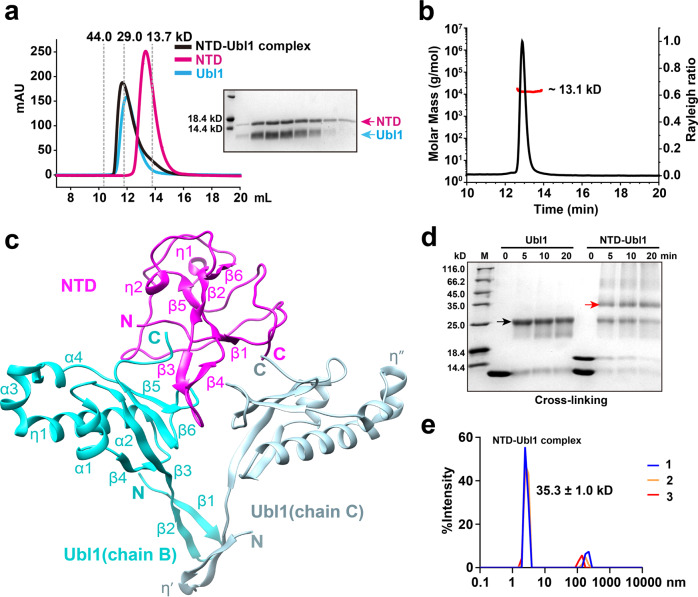
Fig. 3. Crystal structure of SARS-CoV-2 NTD in complex with Ubl1.
a The NTD-Ubl1 complex protein was confirmed by SEC assay. NTD: ~14.3 kD. Ubl1: ~12.9 kD. NTD-Ubl1 complex: ~40.1 kD. The peak positions of three standard proteins are shown as gray dashed lines. b SEC-MALS analysis of Ubl1 in solution. The light scattering data is displayed in a black curve and the molar mass data is shown in a red curve. The calculated MW of Ubl1 is ~13.1 kD. c The crystal structure of the NTD in complex with Ubl1. NTD is shown in magenta, and two Ubl1s are displayed in cyan (chain B) and light blue (chain C). The N- and C- termini of NTD and Ubl1s are marked in the corresponding colors. Compared to chain-B Ubl1, the two extra 310 helices in chain-C Ubl1 are labeled as η′ and η″. d Cross-linking experiments of Ubl1 as well as NTD-Ubl1 complex. The compositions of the samples after cross-linking were identified by SDS-PAGE. Bands corresponding to the dimeric Ubl1 (theoretical MW: ~25.8 kD) and the heterotrimeric NTD-Ubl1 complex (~40.1 kD) are indicated by black and red arrows, respectively. e Dynamic light scattering analysis of the NTD-Ubl1 complex in three independent experiments (n = 3). Radius: ~2.7 nm; Calculated MW: 35.3 ± 1.0 kD. Figure c was prepared using Chimera (http://www.cgl.ucsf.edu/chimera/).

