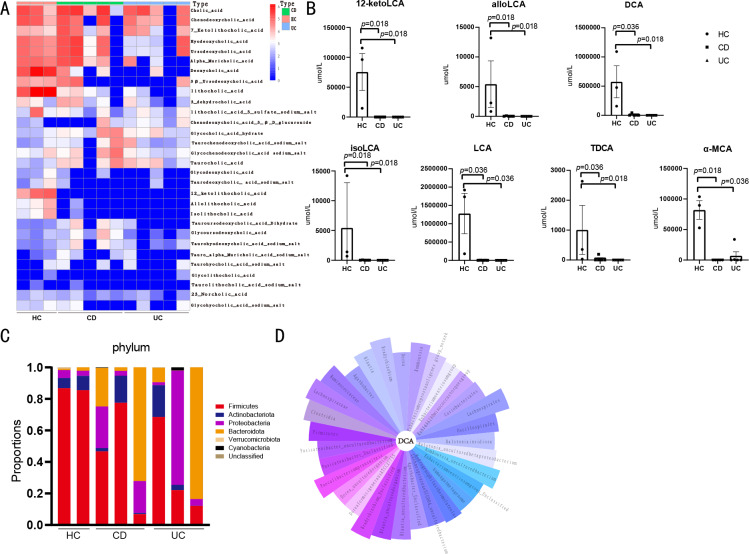
Figure 2. Fecal bile acids are associated with intestinal flora.
(A) Heatmap of human fecal bile acids. (HC n = 3, CD n = 5, UC n = 5). (B) Compared with healthy controls, levels of 12-ketoLCA, alloLCA, DCA, isoLCA and LCA in feces of patients with CD and UC were significantly lower. Level of TDCA was lower in CD patients. Level of α-MCA significantly lower in UC patients compared with healthy controls. (C) The abundance at phylum level: the abundance of Firmicutes decreased in patients with CD and UC. (D) The petal plot shows the intestinal flora associated with DCA, with the band length representing the magnitude of the absolute r of the correlation coefficient.

