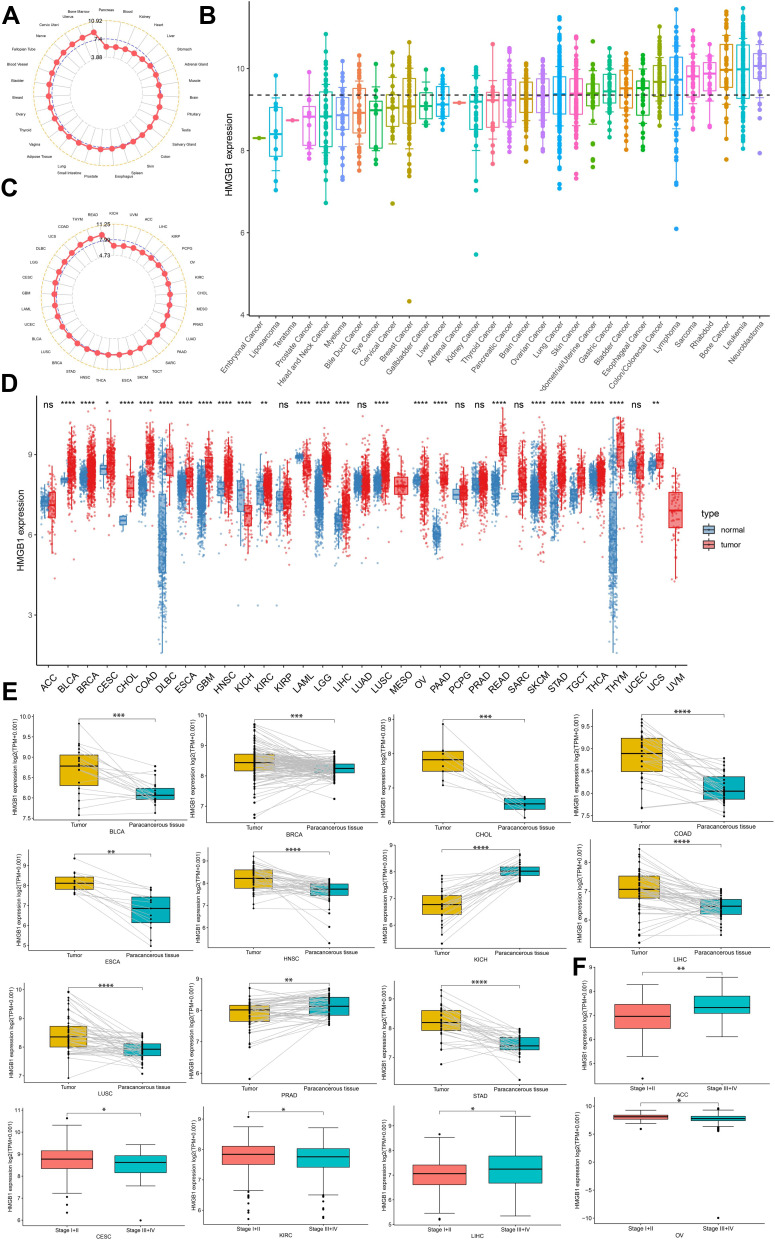
Figure 1.
HMGB1 expression levels in tumors, cancer cell lines, and normal tissues. HMGB1 expression levels in normal tissues (A), cancer cell lines (B), and tumors (C). (D) Comparison of HMGB1 expression levels between tumors and normal tissues. (E) Comparison of HMGB1 expression levels in tumors and matched paracancerous tissues. (F) Comparison of HMGB1 levels in different tumor stages. P > 0.05, < 0.05, < 0.01, < 0.001, and < 0.0001 were presented as “ns”, “*”, “**”, “***”, “****”, respectively.

