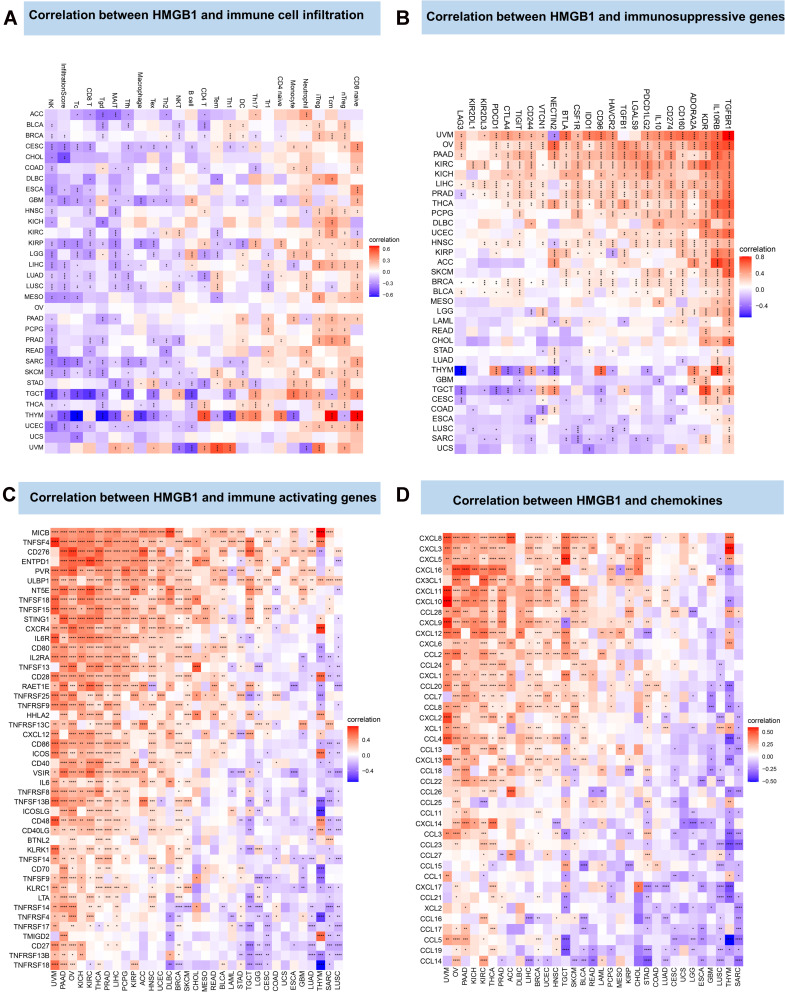
Figure 5.
Correlation between HMGB1 expression and tumor immune infiltration. (A) Correlation between HMGB1 expression and immune cell infiltration by CIBERSORT method. (B) Correlation between HMGB1 expression and immunosuppressive genes. (C) Correlation between HMGB1 expression and immune-activation genes. (D) Correlation between HMG1B expression and chemokines. P > 0.05, < 0.05, < 0.01, < 0.001, and < 0.0001 were presented as “ns”, “*”, “**”, “***”, “****”, respectively.

