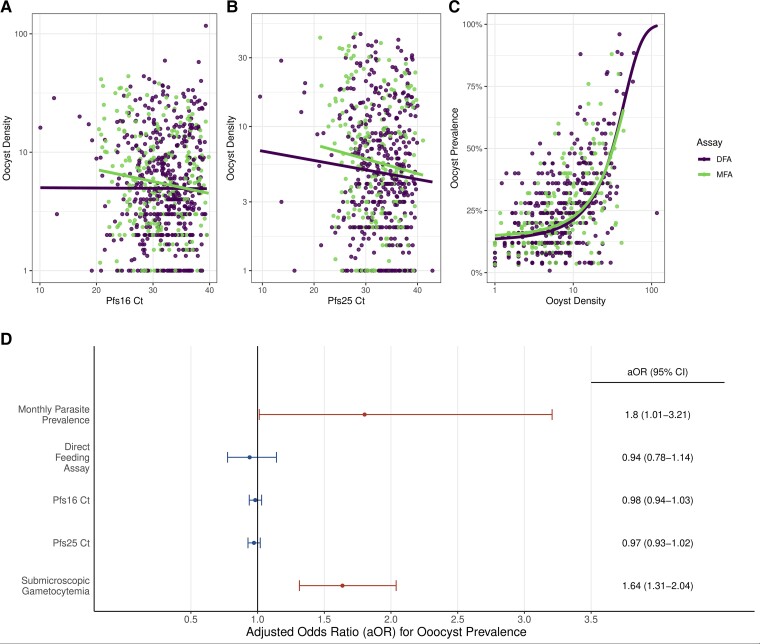
Figure 3.
Relationship and predictors of oocyst density and prevalence. The relationship between oocyst density (the average number of oocysts per feeding assay) and (A) Pfs16 and (B) Pfs25 RT-qPCR Ct is shown for both DFA and MFA. A linear relationship was found to best explain the relationship in both panels A and B, although this was within 2 AIC differences compared with a power law relationship. A significant correlation is observed between oocyst density and Ct in MFA but not DFA (Pfs16 Ct [MFA: P = .002; DFA: P = .509] and Pfs25 Ct [MFA: P = .040; DFA: P = .262]). In panel C, a significant logistic relationship observed between oocyst prevalence (proportion of mosquitoes with at least 1 oocyst per feeding assay) is shown to be positively correlated against oocyst density (P < .001). In panel D, factors significantly associated (P < .05) with oocyst prevalence are shown in red, indicating oocyst prevalence is significantly higher during months with higher parasite prevalence and from submicroscopic sexual infections. The aORs and 95% CIs are shown on the right. Abbreviations: aOR, adjusted odds ratio; CI, confidence interval; Ct, cycle threshold; DFA, direct skin feeding assay; MFA, membrane feeding assay; RT-qPCR, reverse transcriptasereal-time quantitative polymerase chain reaction.

