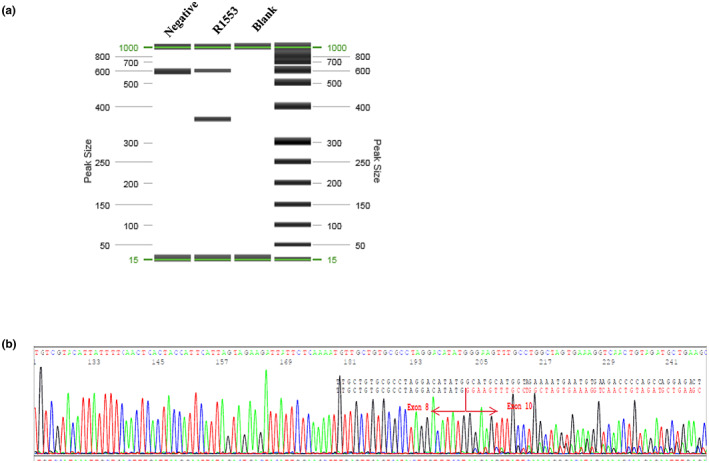
FIGURE 3.

RT‐PCR analysis demonstrates c.4001G > C leads to exon 9 skipping. (a) RT‐PCR products run on QIAxcel. Two extra bands were observed in the patient, but not in the control. (b) Electropherogram showing that the variant causes exon skipping. The boundary of exons is marked by red arrow.
