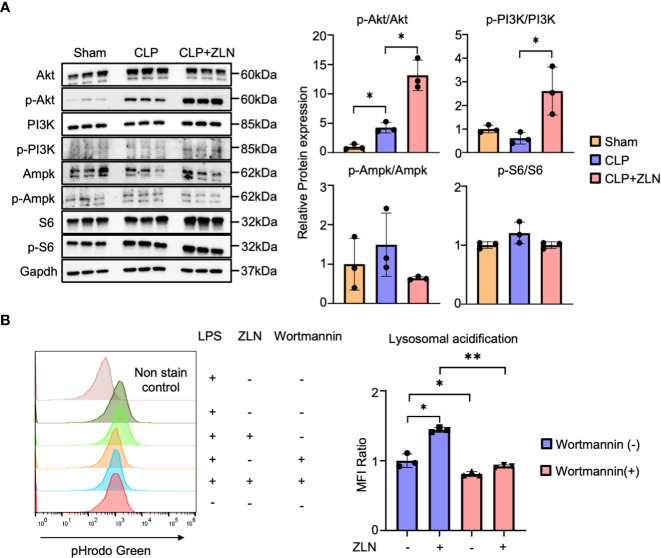
Figure 7.
(A) Western blotting analysis of the molecular pathways of peritoneal cavity cells at 24 hours post-CLP. The graph shows the expression ratio of each protein corrected by Gapdh protein expression level (n = 3). (B) The assessment of lysosomal acidification in THP-1 cells at 5 days post-Wortmannin administration. The statistical significance of differences among two groups, with or without ZLN005 in Wortmannin administration, were evaluated using Kolmogorov-Smirnov test. P values ** < 0.0001, P values * 0.0001 to 0.05.

