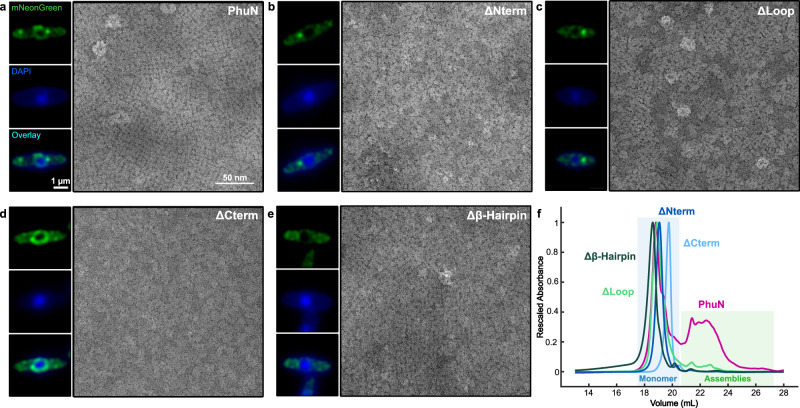
Fig. 4. ϕPA3 PhuN deletions show defects in shell integration in vivo and self-assembly in vitro.
Live fluorescence microscopy and negative stain EM micrographs of a full-length PhuN as well as the following PhuN deletions: b N-terminal tail (residues 1–37), c Loop (residues 272–291), d C-terminal tail (residues 556–602), and e β-Hairpin (residues 111–126). Fluorescence microscopy images of PhuN or PhuN deletions were collected at 40 min post-infection, deconvolved, and are displayed in green while the DAPI-stained DNA is shown in blue. The 1 µm and 50 nm scale bars apply to all fluorescence and EM panels, respectively. (Independent sample preparation and imaging: fluorescence microscopy n = 3, negative stain EM n = 1). f Rescaled anion exchange traces for the deletions shown in panels a–e. The decreased propensity for PhuN assembly on the column is evidenced by the sharp increase in the primary peak corresponding to the monomeric species (blue box) relative to the assembly peaks (green box). Samples from monomeric peaks were used for negative stain in panels a–e.

