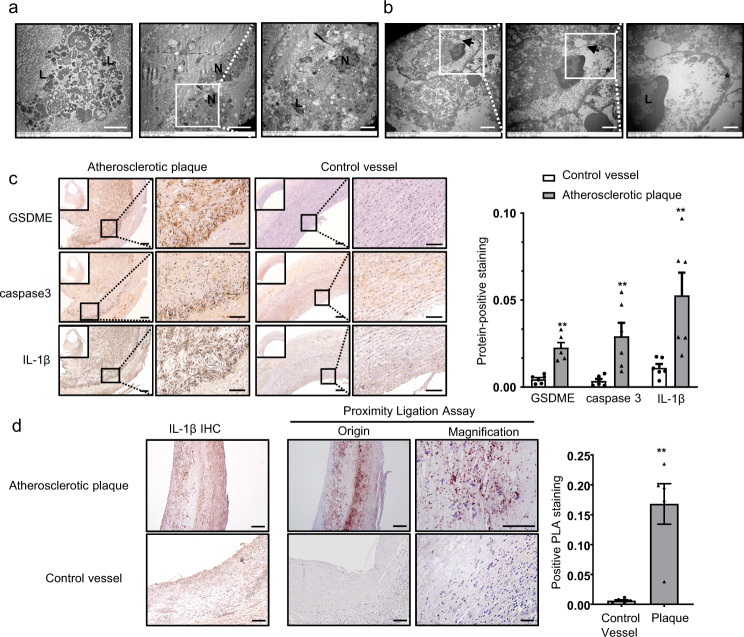
Fig. 1. Indications of occurrence of pyroptosis in human and mouse atherosclerotic plaques.
a Electron microscopic appearance of macrophage death in human atherosclerotic plaques. Fragments of a dying macrophage with still recognizable lysosomes (L). Macrophages with normal-looking nucleus (N) and numerous lysosomes (L) containing inclusions of phagocytosed cell remnants. Representative electron microscopic analysis of six different human plaques from one experiment. Scale bar: 5 μm; Scale bar: 2 μm (magnification). b Transmission electron microscopy (TEM) images of a suspected pyroptotic macrophage in human carotid artery atherosclerotic plaques. The arrows indicate pore formation and discontinuity of the cell plasma membrane. Scale bar: 2 μm (right), Scale bar: 1 μm (middle), Scale bar: 500 nm (right); Asterisks indicate cell membrane thickening. Representative electron microscopic analysis of six different human plaques from one experiment. c Immunohistochemical staining of GSDME, caspase 3, IL-1β in human carotid artery compared with control vessels (human normal abdominal artery derived from autopsy) and the protein integrated optical density (IOD)/area between the two groups are shown (mean ± SEM, n = 6). GSDME (**P = 0.004), caspase 3 (**P = 0.004), IL-1β (**P = 0.004). Scale bar: 200 μm; Scale bar: 100 μm (magnification) . d In situ detection of the interaction of GSDME and caspase 3 in human carotid atherosclerotic plaques and control vessels (mean ± SEM, n = 5) using a generalized proximity ligation assay compared with immunohistochemical staining of IL-1β. **P = 0.009. For all panels, P value was determined by two-tailed Mann–Whitney U test. Scale bar: 100 μm; Scale bar: 50 μm (magnification) . Source data are provided as a Source Data file.

