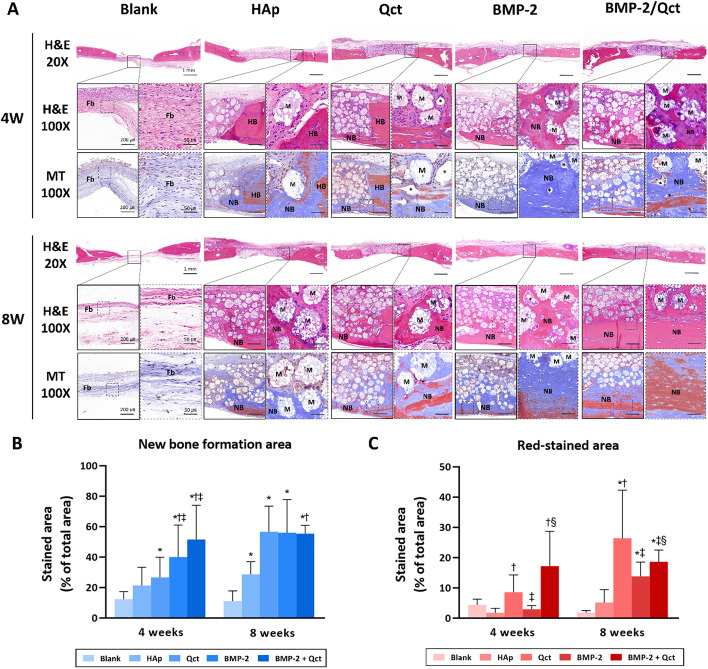
Fig. 5.
Histological sections and histomorphometrical analysis of calvarial bone defects. A Representative images of H&E and Masson’s trichrome stains at 4 and 8 weeks. B Percentage of new bone formed area in H&E stains (blue bar), and C red-stained area in Masson’s trichrome stains at 4 and 8 weeks. Scale bar = 1 mm (×20 images), 200 µm (×100 images), and 50 µm (×400 images in the dotted line box). Fb: fibrous tissues; NB: newly formed bone; HB: host bone; M: implanted beads; asterisk: blood vessel. p < 0.05 compared to the blank (*), HAp (†), Qct (‡), and BMP-2 (§) groups

