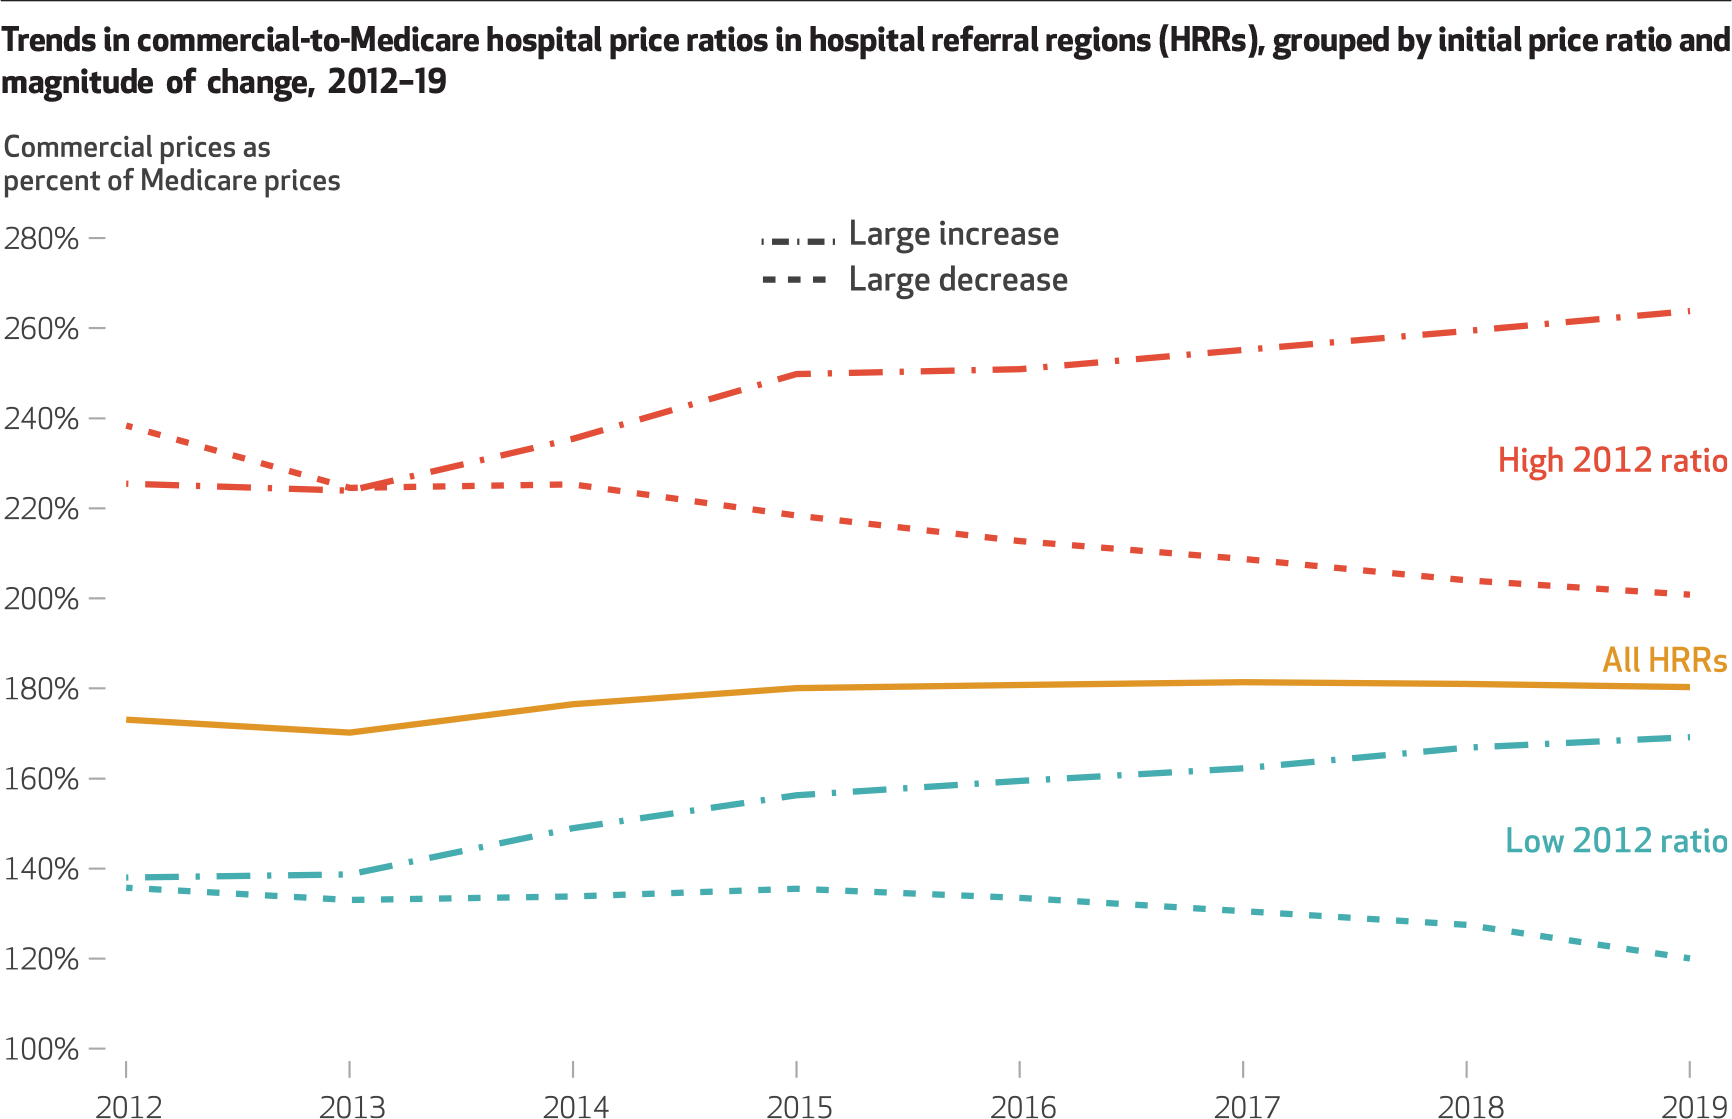
Exhibit 1. Trends in commercial-to-Medicare hospital price ratios in hospital referral regions (HRRs), grouped by initial price ratio and magnitude of change, 2012–19.

SOURCE Authors’ analysis of 2012–19 Healthcare Cost Report Information System (HCRIS) data. NOTES Price ratio estimates reflect estimated commercial revenue-to-charge ratios divided by Medicare revenue-to-charge ratios. “High 2012 ratio” and “Low 2012 ratio” refer to HRRs with the highest 25 percent (top quartile) and lowest 25 percent (bottom quartile) of commercial-to-Medicare price ratios in the initial year of the study period. “Large increase” and “Large decrease” refer to HRRs that, within their initial price ratio group, are in the top and bottom quartiles of price ratio change, as measured during the 2012–19 study period. Price ratios are weighted by the number of commercial discharge equivalents.
