Abstract
Raman spectroscopy using feature selection schemes has considerable advantages over gas chromatography for the analysis of fatty acids’ composition changes. Here, we introduce an educational methodology to demonstrate the potential of micro-Raman spectroscopy to determine with high accuracy the unsaturation or saturation degrees and composition changes of the fatty acids found in the lipid droplets of the LNCaP prostate cancer cells that were treated with various fatty acids. The methodology uses highly discriminatory wavenumbers among fatty acids present in the sample selected by using the Support Vector Machine algorithm.
Keywords: Raman spectroscopy, Support vector machine (SVM), Lipids, Fatty acids, Prostate cancer, Near-infrared, Noninvasive
1. Introduction
Cancer cells have very well-defined pathways to facilitate fatty acids’ metabolism. Fatty acids are obtained from endogenous de novo biosynthesis or from dietary sources and can be used for energy storage in the form of cytoplasmatic lipid droplets (LDs). These LDs contain neutral lipids, like triacylglycerides (TAG) and steryl esters (STE), and are surrounded by a monolayer of phospholipids and proteins [1–3]. The fatty acid biosynthesis requires the activation of enzymes that lead to the production of a 16-carbon chain of saturated fatty acid (16:0, palmitate) [4–6], which serves as a precursor for the generation of longer chain and unsaturated fatty acids like oleic acid (18:1). Hormones that bind steroid receptors in cancer cells (like androgen to androgen receptor and progesterone to progesterone receptor) are known to induce the lipid synthesis program inside the cells [7, 8]. Palmitic and oleic acids are abundantly made by the cancer cells in response to hormone treatment, and pharmacological inhibition of their synthesis has been shown to decrease cancer cell viability and resistance to chemotherapy agents [9]. Thus, the accumulation of LDs inside cancer cells seems to be a hallmark of cancer metabolism and growth that can be exploited for biomarker discovery. Lipid content is usually analyzed by using gas chromatography/mass spectroscopy [9], but the cellular dynamics and the lipids’ distribution are lost during the homogenization process. Moreover, these techniques cannot be used in vivo or for live cell studies. Raman spectral data sets are large, with subtle differences and spectral overlapping, which requires dimension reduction to extract essential information from the original data. The feature selection can be improved using Support Vector Machine (SVM) and kernel functions for feature extraction [10, 11]. Therefore, we have combined Raman spectroscopy with a wavenumber selection multiclass-SVM algorithm to identify those discriminative wavenumbers of fatty acid methyl esters (FAMEs) present in the samples in order to analyze with better accuracy the fatty acids’ composition changes and the unsaturation/saturation degrees of the samples under investigation.
In this study, we validate our methodology on prostate cancer cell line LNCaP samples; the control sample, the sample treated individually with specific FAMEs, and a sample treated with a mixture of FAMEs. Although we focus on prostate cancer cell samples in this study, we believe that the study of unsaturation/saturation of fatty acids in individual LDs will open new lipid-based avenues for cancer cell research in general.
2. Materials
2.1. Fatty Acid Methyl Ester (FAME) Standards (Sigma-Aldrich Corp)
Methyl Oleate 31111 ≥99% (GC) liquid (OA).
Methyl Linoleate L1876 ≥99% (GC) liquid (LOA).
Methyl Palmitoleate P9667 ≥99% (GC), liquid (POA).
Methyl Arachidonate A9298, ≥99% (GC) liquid (AA).
Methyl Stearate S5376 ~99% (GC) solid (SA).
Methyl Palmitate P5177 ≥99% (GC) solid (PA).
2.2. LNCaP Prostate Cancer Cells
The LNCaP prostate cancer cells were purchased from the University of Colorado Cancer Center Cell Technologies Shared Resources.
2.3. Suppliers, Consumables, etc.
35 mm glass bottom dishes no. 1, poly-D-lysine coated.
4% formaldehyde.
Phosphate buffer saline (PBS).
200 proof Molecular-grade ethanol to dissolve FAMEs.
RPMI cell culture media supplemented with 10% FBS and 1% pen/strep antibiotics.
2.4. Instrumentation/Experimental Setup
Use a confocal Raman microscope to measure the LDs. A custom microscope [12] represented in Fig. 1 was built in backscattering geometry using an Olympus IX70 inverted research microscope.
Choose a 300 lines/mm grating to spectrally disperse the signal onto the sensor plane.
Use a motorized scanning stage (ASI Inc., MS-2000) to record groups of Raman spectra with five scans per measurement point.
Fig. 1.
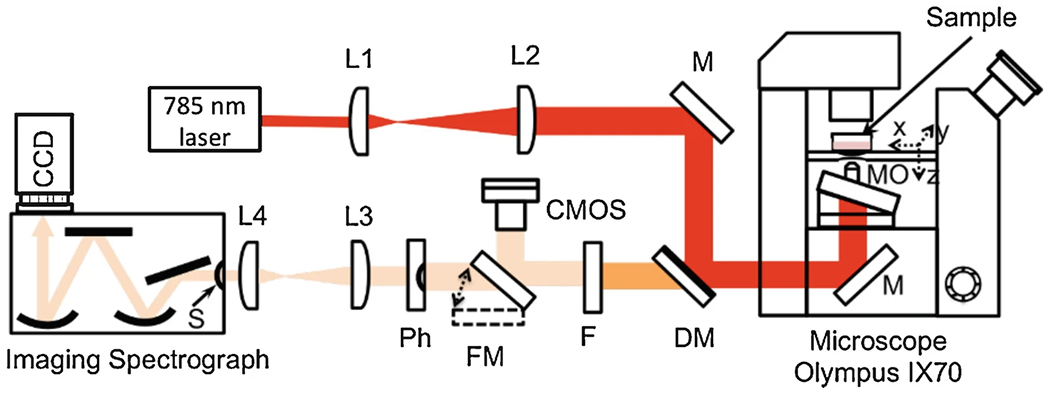
Scheme of the Raman micro-spectroscopy setup; 785 nm laser (Innovative Photonic Solutions), L1, L2, L3, L4 = lenses with focal lengths f1 = 15 mm, f2 = 175 mm, f3 = 75 mm, f4 = 25 mm, M = mirrors, DM = dichroic mirror (Semrock, 785 nm Razor Edge), FM = flipper mirror, Ph = pinhole with diameter d = 150 μm, F = longpass filter (Semrock, 785 nm Razor Edge Ultrastep with cutoff at 786.7 nm and rejection OD of 6), S = slit, imaging spectrograph (Czerny-Turner style, Acton SP2500), CCD (cooled CCD camera, Pixis 100, Princeton Instruments), CMOS camera (for sample visualization), XYZ (motorized scanning stage, ASI Inc., MS-2000), and MO = microscope objective (Olympus, UPlanSApo 60 × W IR, NA = 1.2)
3. Methods
Carry out all procedures at room temperature unless otherwise specified.
3.1. FAME Samples Preparations
We recorded the palmitate and stearate samples spectra in solid and liquid form. The liquid samples were obtained by melting the solid samples, and the solid and liquid spectra were averaged.
Use individual FAME samples of OA, LOA, POA, AA, PA, and SA.
Use mixtures ofOA+LOA (50% by volume), OA+LOA+POA (33% by volume), and OA + LOA + POA + AA (25% by volume) samples.
3.2. Preparation of FAMEs for Tissue Culture
Dissolve the FAMEs in 200 proof molecular-grade ethanol to a concentration of 10 mM and store at –20 °C.
Prepare single or mixture of FAMEs by diluting the FAME stocks to 100 μM in cell culture media containing RPMI supplemented with 10% FBS and 1% pen/strep antibiotics.
3.3. Treatment of the Cells
Grow LNCaP cells in glass bottom dishes to a 70% confluency.
Keep a few dishes of LNCaP prostate cancer cells without FAMEs treatment; these will be used as the control samples.
3.4. Spectra Recording
Record a few groups of five Raman spectra from a point scan of polystyrene beads in the region between 300 and 1800 cm−1, and take the average. The mean values of these spectra would count for the calibration of the Raman shifts.
Record several Raman spectra of each pure fatty acid in the region between 300 and 1800 cm−1: OA, LOA, POA, and AA in liquid form, and PA, SA in solid and liquid form, 45 scans per samples with 10 s integration time. The PA and SA were melted using a heat gun.
Record several Raman spectra of a mixture of fatty acid in the region between 300 and 1800 cm−1: OA + LOA, OA + LOA + POA, and OA + LOA + POA + AA, 45 scans per samples with 10 s integration time. Calculate the average spectra.
Record several Raman spectra of LNCaP cancer cell LDs in the region between 300 and 1800 cm−1. We used in this study 12 groups (12 cells) of 45 spectra each, acquired from nine lipid droplets inside the cell, with five spectra recorded for each point scan. Calculate the average spectra for each group.
Record a group of five Raman spectra from a point scan of media outside the cell area in the region between 300 and 1800 cm−1. The mean values of these spectra would count for the background subtraction from each of the spectra mentioned above.
3.5. Raman Spectra Processing
Process the Raman data with MATLAB (Mathworks Inc.) using custom routines and the bioinformatics toolbox.
Remove the background signal containing cosmic rays, and signal from the glass coverslip and PBS solution performing the following data processing steps: (1) cosmic rays removal [13] (see Note 1), (2) data smoothing using a 5-point moving average filter, (3) background removal (see Note 2) by subtracting an average of several-point Raman spectra acquired off of the cell sample (glass and PBS only), (4) baseline correction using bioinformatics tool routines (see Note 3), and (5) data normalization by the area under the curve for the FAMEs and by the mean area under the curve of the LNCaP control cells spectra for the other LNCaP cancer cells.
Calibrate the Raman shifts (cm−1) using polystyrene reference spectra (see Note 4).
The processed Raman spectra for the pure fatty acids, mixture of fatty acids, and LNCaP cancer cell lines are shown in Figs. 2a, b and 3, respectively.
Use the MATLAB function Error Correction Output Codes (ClassificationECOC) to predict labels (see Note 5) or posterior probabilities for the processed data by using multiple binary learners SVMs (Fig. 4a–h). The SVM template was created by using a Gaussian rbf kernel to standardize the predictors. The results of the ECOC classifier are presented in Subheading 3.10.
Choose those peaks with very high classification accuracy, that are >0.92.
Do not choose the peaks at 1263 and 1299 cm−1 for unsaturation/saturation analysis. The classification accuracy for the two peaks combination is too low 0.7642 (Fig. 4f). These peaks overlap. Details about peaks selection are given in Subheading 3.10.
Fig. 2.
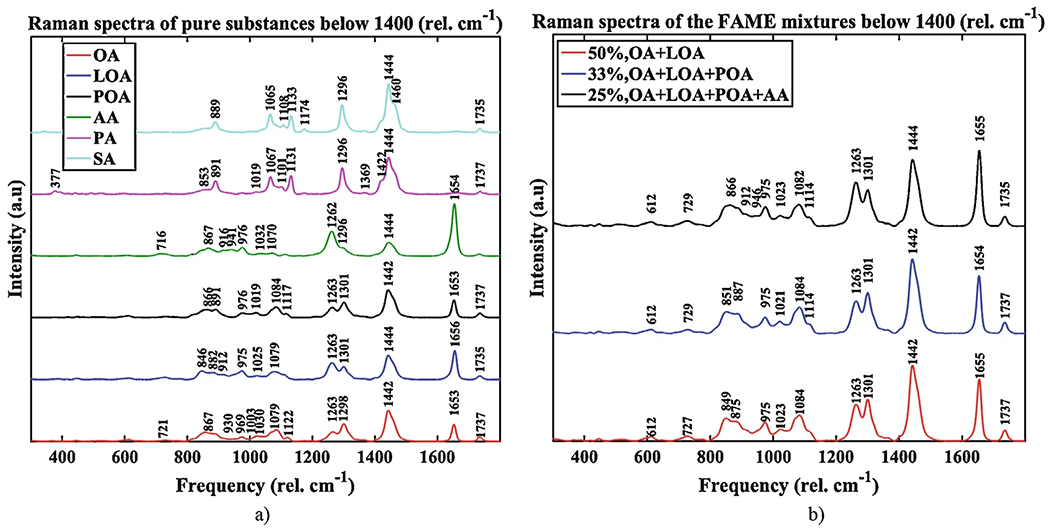
FAME Raman spectra below 1800 cm−1; (a) Raman spectra of individual FAME; the pure substances are, from the bottom to the top, oleate OA (Sigma, >99% GC), linoleate LOA (Sigma, >99%), palmitoleate POA (Sigma, >98.5%, GC), arachidonate AA (Sigma, >99%), palmitate PA (Sigma, >99%, GC), and stearate SA (Sigma, >99%, GC); we recorded the palmitate and stearate samples spectra in solid and liquid form (not shown) by melting the solid samples, and the solid and liquid spectra were averaged; (b) Raman spectra of FAME mixtures: 50% OA + LOA, 33% OA + LOA + POA, and 25% OA + LOA + POA + AA. OA oleic acid, POA palmitoleic acid, LOA linoleic acid, AA arachidonic acid, PA palmitic acid, SA stearic acid
Fig. 3.
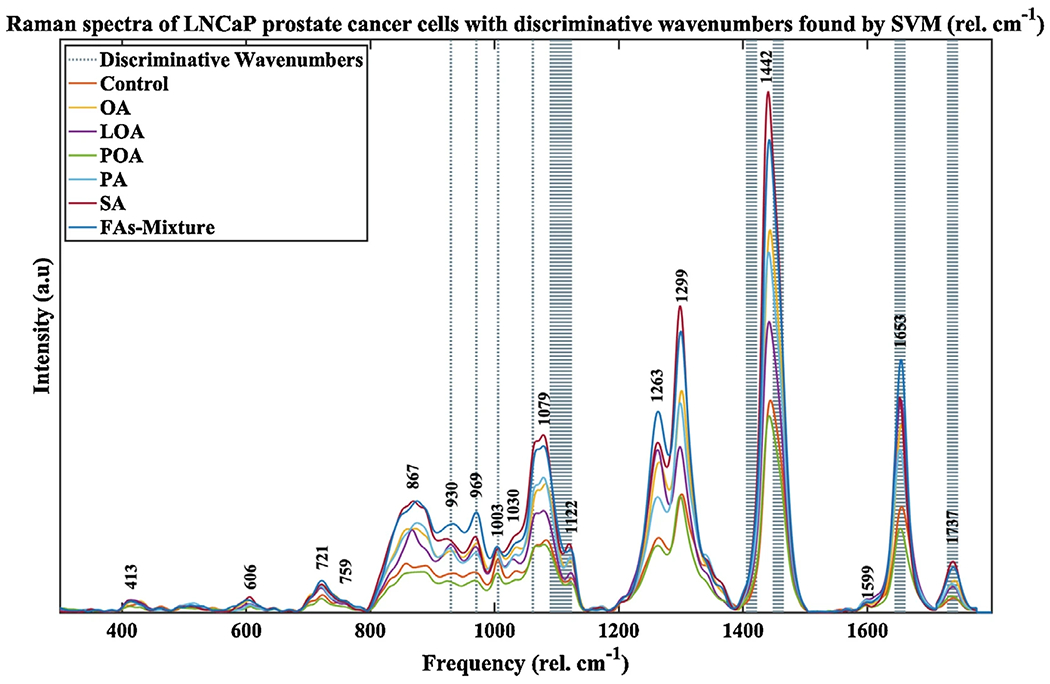
Average low wavenumber Raman spectra of treated (single and mixture), and vehicle (control) LNCaP cancer cells with discriminative wavenumbers found by SVM. The most pronounced changes between spectra of treated and control cell samples occurred for in the 800–1800 cmr−1 region
Fig. 4.
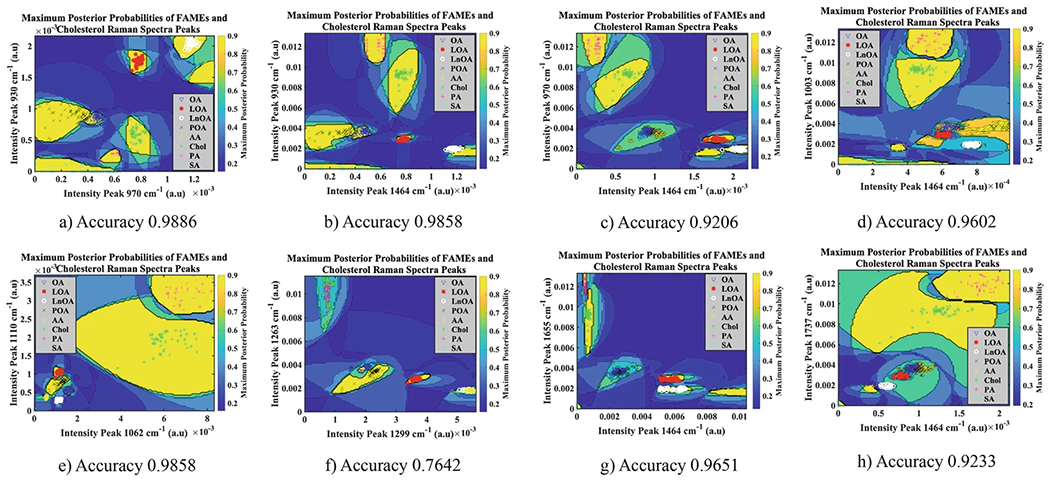
Maximum posterior probabilities of FAMEs; (a) peak 970 cm−1 to peak 930 cm−1, accuracy 0.9886; (b) peak 930 cm−1 to peak 1464 cm−1, accuracy 0.9858; (c) peak 970 cm−1 to peak 1464 cm−1, accuracy 0.9206; (d) peak 1003 cm−1 to peak 1464 cm−1, accuracy 0.9602; (e) peak 1110 cm−1 to peak 1062 cm−1, accuracy 0.9858; (f) peak 1263 to peak 1294–1300 cm−1, accuracy 0.7642; (g) peak 1655 cm−1 to peak 1464 cm−1, accuracy 0.9651; (h) peak 1737 to peak 1464 cm−1, accuracy 0.7642. OA oleic acid, POA palmitoleic acid, LOA linoleic acid, AA arachidonic acid, PA palmitic acid, SA stearic acid, Chol cholesterol
3.6. Least Square Fitting
To fit the Raman experimental data, we assume that each LD spectra can be described by a linear combination of the spectra of pure components. In this case, we wish to solve for the coefficients of the linear equation: where d is the experimental LD spectrum, ci, are coefficients, and si are the pure substance spectra. To solve for the coefficients, perform the following steps:
Perform a least square fit of the processed data using built-in functions in Matlab (Mathworks Inc.) in the Curve Fitting toolbox, constraining the coefficients to positive values (see Note 6).
Calculate the standard deviation of the mean of samples (SE) by taking the ratio of the sample standard deviation divided by the square root of the sample size. The sample size would be N = 12, which is the number of the groups or the number of the averaged spectra.
Use the MATLAB subroutine barweb to plot five groups of 6 bars with errors, five represents the number of treatments: OA, LOA, POA, PA, and SA, and six represents the number of pure fatty acids being identified: OA, LOA, POA, AA, PA, and SA (see Note 7).
The processed Raman spectra for the pure fatty acids and the LNCaP cancer cell lines are shown in Figs. 2a, b and 3, respectively.
3.7. Raman Vibrational Mode Assignment
Various fatty acid vibrational modes responsible for the differences observed in the spectra in the figures above are readily assigned to known lipid/triglycerides vibrational modes (see Table 1).
Table 1.
| Peak number | Wavenumber (cm−1) | Assignment |
|---|---|---|
| 1 | 727 | δ (=C-H) in-plane |
| 2 | 800–920 | ν (C1-C2), CH3,rk, ν (C=O) Solid: mixture of stretches and rocks at acyl and methyl terminals. Complex broad plateau in liquid state |
| 3 | 972 | δ (=C-H) out-of-plane |
| 4 | 1060–1065 | ν (C-C)op Out-of-phase: aliphatic C-C stretch all trans |
| 5 | 1080–1110 | ν (C-C)ig Liquid: aliphatic C-C stretch in gauche and ν (C-C), Solid: aliphatic C-C stretch all trans |
| 6 | 1120–1135 | ν (C-C)ip in-phase aliphatic C-C stretch all-trans |
| 7 | 1171 | (CH2) rotation |
| 8 | 1250–1280 | δ (=CH)ip in-plane cis olefinic hydrogen bend |
| 9 | 1295–1305 | δ (CH2)tw Methylene twisting deformations |
| 10 | 1400–1500 | δ (CH2)sc Methylene scissor deformations, δ (CH2) |
| 11 | 1640–1680 | ν (C=C) cis double bond stretching mode (Olefinic) |
| 12 | 1730–1750 | ν (C=O) in -CH2-COOR ester carbonyl stretching mode |
Note: ν and δ indicate stretching and deformation vibrations
3.8. FAME Reference Lipids Biomarkers by Micro-Raman Spectroscopy
Create a database of reference fatty acid spectra by acquiring Raman spectra of FAMEs: oleate C18:1 (OA, liquid), linoleate C18:2 (LOA, liquid), palmitoleate C16:1 (POA, liquid), ara-chidonate C20:4 (AA, liquid), palmitate C16:0 (PA, solid), and stearate C18:0 (SA, solid).
Normalize FAME spectra by the area under each curve and not by the carbonyl peak, as it is described in reference [22]. The carbonyl peak changes its position in regards to the saturation status of the fatty acids, and it cannot be considered as an internal standard for all the fatty acids under investigation. The normalization is necessary since both forms of unsaturated and saturated fatty acids are utilized.
Typical corrected and normalized mean Raman spectra of FAME are shown in Fig. 2a.
Record Raman spectra of liquid FAME mixtures in amounts of 50% OA and LOA, 33% of OA, LOA, and POA, and 25% of OA, LOA, POA, and AA (Fig. 2b). These spectra are needed to validate our method to assign the unsaturation/saturation degrees of fatty acid mixtures.
The analysis of these spectral features is described below, in Subheading 3.10.
3.9. LNCaP Prostate Cancer Cell Lipids Biomarkers by Micro-Raman Spectroscopy
Acquire Raman spectra of LNCaP prostate cancer cell line, control, and treated samples with individual FAMEs and mixture of FAMEs for 4 days.
Normalize the Raman spectra of the LNCaP cells by the mean area under the curve of the LNCaP control cells spectra after the background removal mentioned in Subheading 3.5.
Typical corrected and normalized mean Raman spectra of LNCaP cancer cells are shown in Fig. 3.
These spectra have an overall shape of unsaturated fatty acids, and therefore we expect to see more unsaturation in the LNCaP lipid droplets. All of the LNCaP cells did respond to the treatment. The specific Raman peaks responsible for the differences observed in the spectra are also assigned to known lipid vibrational modes (see Table 1) and are sensitive to differences in lipid composition within cytoplasmic lipid droplets. The analysis of these spectral features is also described below in Subheading 3.10.
3.10. Lipid Unsaturation/Saturation Analysis
Lipid droplets in cells consist of a neutral lipid core (primarily triacylglycerides (TAGs) and cholesteryl esters) enclosed by a phospholipid membrane. TAGs consist of a glycerol molecule joined by an ester bond to three fatty acid molecules. Raman signal from cellular lipid droplets occurs primarily from the chemical bonds C-O, C-C, C=C, and C-H [14, 22–26]. Unsaturated fatty acids contain more C=C bonds (represented by the 1653–1655 cm−1 band), while saturated fatty acids contain more CH2 groups and therefore have larger Raman peaks for those vibrational modes associated with CH2.
Understand the iodine value (IV). By definition, the iodine value (IV) is the measurement of the unsaturation of fats and oils in a sample and is expressed in terms of the grams iodine absorbed or consumed by 100 g of fat under standard conditions. Several methods were employed for determining the iodine value of lipids, but the most used one is “Hanus method” [27]. The method consists of treating the fatty acid under study with iodine monobromide (IBr) in glacial acetic acid and after that treating the excess reagent with a standard solution of sodium thiosulfate. The IV of fatty acids can be correlated with their degree of unsaturation in various ways.
It should be possible to determine the degree of saturation by calculating the peak ratios of specific bands or by looking at the relative concentrations between the total amount of saturated fatty acids and the total amount of unsaturated fatty acids (see Note 8). However, taking the ratio of the bands at 1294–1299 and 1263 cm−1, this is problematic due to the overlap of these two bands (accuracy in separation = 0.7642, Fig. 4f). The same procedure is possible for the peak ratio of the Raman bands at 1655 and 1448 cm−1 (NC=C/NCH2), the latter one being a particular shoulder of the 1442 cm−1 peak. We localized this band from 1448 to 1464 cm−1. These two bands represent the ν (C=C) cis double bond stretching mode (olefinic), which is proportional with the number of C-double-bonds, and the δ (CH2)sc methylene scissor deformations, which is proportional to the number of C-single-bonds. These two bands show very distinctive peaks in Figs. 2a, b and 3, and do not overlap with other Raman peaks (accuracy 0.9651, Fig. 4f). The greater the number of C=C bonds, the higher the IV, and the more reactive and oxidative the fatty acids are.
Take the peak ratio of the Raman bands at 1655 and 1448 cm−1 (NC=C/NCH2). Repeat this step for all Raman spectra, pure fatty acids, and LNCaP cancer cells, treated with fatty acids and control.
Collect all peak ratios in a table (see Table 2).
Explore the linear relationship between the two peaks, 1655 and 1448 cm−1, of various fatty acids with different degrees of unsaturation (Fig. 5a).
Repeat step 5 for the LNCaP cancer cells LDs, without knowing their fatty acid composition, Fig. 5b.
We imported here some notations from reference [29]. For a better linear fit, we introduced the eicosapentaenoic acid (EPA) with five of C-double-bonds. The best fit-line is a linear equation that allows us to predict the unknown NC=C/NCH2 ratios and has the expression y = 9.1272x − 0.0012, with RMSE of about 0.99.
Using this expression, predict the degree of unsaturation for the mixture samples of 50%OA+ LOA, 33%OA+ LOA + POA, and 25% OA + LOA + POA + AA, from the spectra in Fig. 2b. The results are shown in Table 2, column NC=C/NCH2. The unsaturation ratios of these samples lie between the unsaturation values of LOA and POA (Fig. 5a). In a similar manner, we can predict the unsaturation/saturation degrees for the LNCaP cancer cell samples treated or untreated with FAME. These samples are more saturated than the FAME mixture samples, and therefore the unsaturation/saturation ratios of these samples lie between the OA and PA (Fig. 5b). The experimental values are colored in black, and the predicted values are colored in red in Table 2.
The iodine values do not follow a linear relationship either with the ratio NC=C/NCH2 nor the peak ratio of the Raman bands at 1655 and 1448 cm−1. The best fit-line of the FAME’s (Fig. 6a) iodine values versus the ratio 1655 cm−1/1448 cm−1 is a quadratic equation that allows us to predict the unknown iodine values and has the expression y = −9.3228.x2 + 124.28x + 9.3564, with RMSE of about 0. 99 (Fig. 6a).
Using this expression, predict the iodine values for the mixture samples of 50% OA + LOA, 33% OA + LOA + POA, 25% OA + LOA + POA + AA (Fig. 6a), and for the LNCaP cancer cell samples, treated or untreated with FAME (Fig. 6b).
Notice from Fig. 7b and from the values in Table 2, column IV Iodine value, that the iodine values of the LNCaP samples has the same trend as the unsaturation ratios and they lay on the quadratic curve between the iodine values of the pure fatty acids OA and PA.
Table 2.
Summary of Raman characteristics of pure methyl ester fatty acidsa
| Pure unsaturated FAME | NC=C, # of double bonds per molecule | NCH2, # of CH2 groups per molecule | NC=C/ NCH2 | IV Iodine value [28] | 1655/1448 ν (C=C)/ δ(CH2)sc | Carbonyl position C=O |
|---|---|---|---|---|---|---|
| PA | 0 | 14 | 0 | 0 | 0 | 1743 |
| OA | 1 | 14 | 0.0714 | 89.85 | 0.6478 | 1745 |
| LOA | 2 | 12 | 0.1666 | 180.99 | 1. 4158 | 1745 |
| POA | 1 | 12 | 0.0833 | 99.76 | 0. 7449 | 1745 |
| AA | 4 | 10 | 0.4 | 333.43 | 3.8419 | 1738 |
| EPA | 5 | 8 | 0.625 | 419.56 | 5.61 | |
| OA + LOA | 0.1078 | 122.7758 | 0.9854 | 1745 | ||
| OA + LOA + POA | 0.1031 | 118.2045 | 0.9424 | 1745 | ||
| OA + LOA + POA + AA | 0.151 | 163.0853 | 1.3797 | 1743 | ||
| LNCaP-Control | 0.0573 | 71.8048 | 0.5232 ± 0.015 | 1744 ± 3.2017 | ||
| LNCaP-OA | 0.0567 | 72.0338 | 0.5251 ± 0.0128 | 1748 ± 0.3684 | ||
| LNCaP-LOA | 0.0828 | 99.3046 | 0.7684 ± 0.0448 | 1744 ± 0.7838 | ||
| LNCaP-POA | 0.0505 | 64.8995 | 0.4632 ± 0.0142 | 1742 ± 1.0733 | ||
| LNCaP-PA | 0.0554 | 71.0026 | 0.5162 ± 0.014 | 1743 ± 0.3855 | ||
| LNCaP-SA | 0.0511 | 66.4014 | 0.4765 ±0.0103 | 1744 ± 0.2133 | ||
| LNCaP-Mixture | 0.0622 | 78.8697 | 0.5853 ± 0.0077 | 1746 ± 0.4996 |
OA oleic acid methyl ester, POA palmitoleic acid methyl ester, LOA linoleic acid methyl ester, AA arachidonic acid methyl ester, PA palmitic acid methyl ester, SA stearic acid methyl ester, EPA eicosapentaenoic acid
Fig. 5.
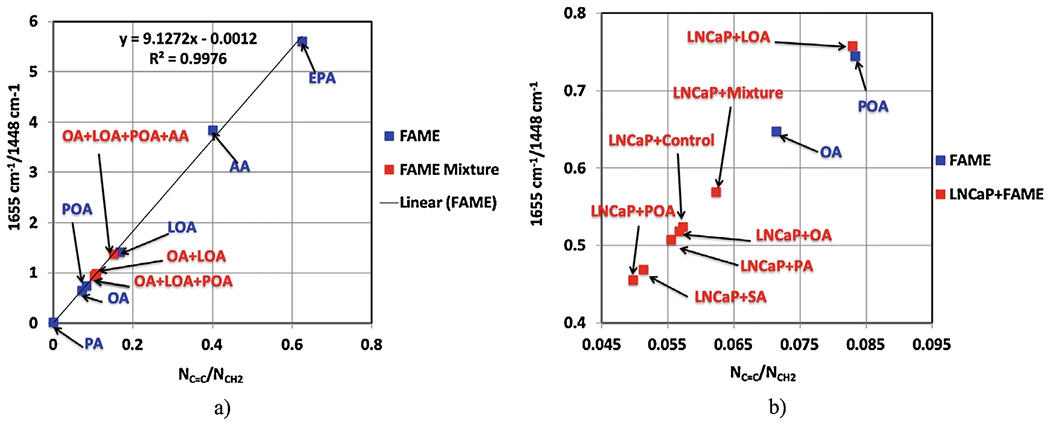
Relationship between the ratio 1655 cm−1/1448 cm−1 and the average ratio of double-to-single carbon–carbon bonds NC=C/NCH2; (a) Individual FAME and mixture of FAME; (b) Individual FAME and LNCaP treated with FAME. We kept the POA and OA on the calibration curve to be able to expand the region between the PA and POA
Fig. 6.
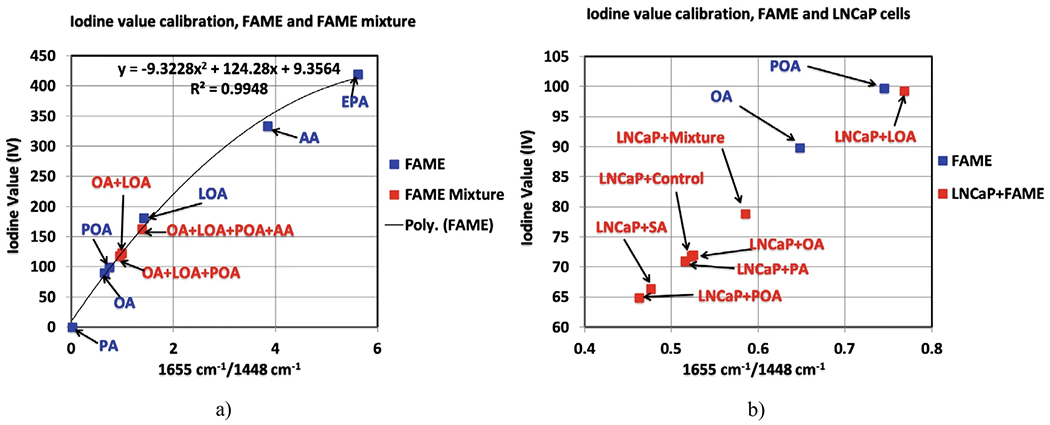
Iodine values calibration; (a) Individual FAME and mixture of FAME; (b) Individual FAME and LNCaP treated with FAME. We kept the POA and OA on the calibration curve to be able to expand the region between the PA and POA
Fig. 7.
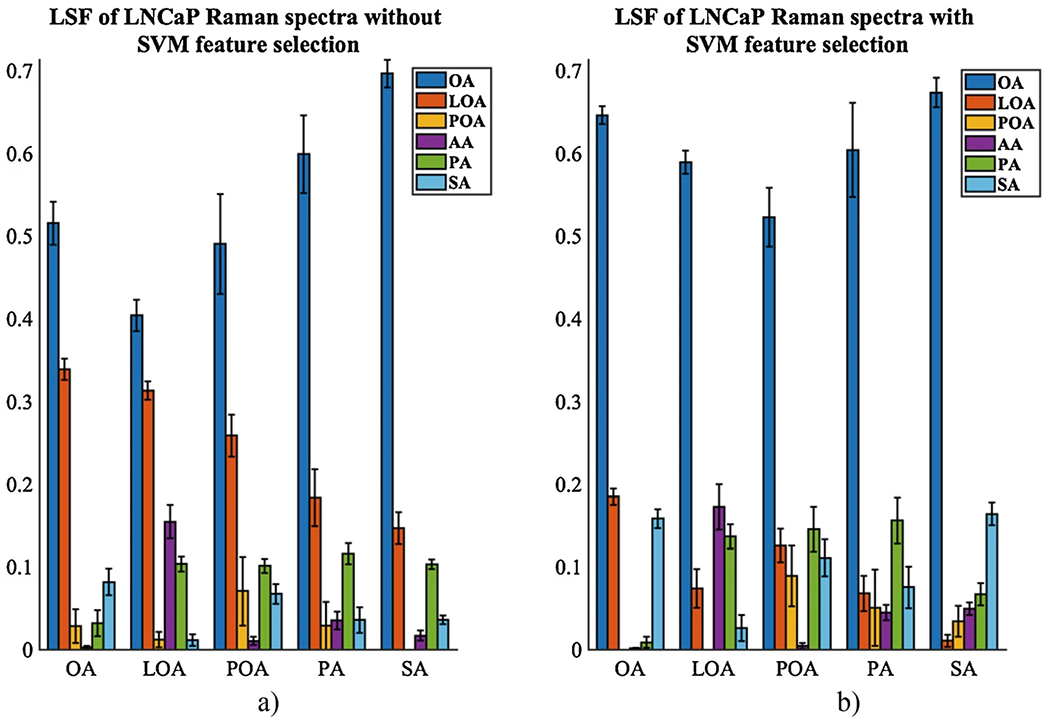
Relative concentrations of fatty acids from least squares fit of experimental Raman measurements of lipid droplets for individual FAMEs-treated LNCaP without SVM (a) and with SVM (b). Standard deviations are shown. OA oleic acid, POA palmitoleic acid, LOA linoleic acid, AA arachidonic acid, PA palmitic acid, SA stearic acid. All FAMEs sample were liquids, except the PA and SA samples. PA and SA samples spectra were recorded in liquid form and solid form as well by melting the solid samples with a heat gun. The final spectra for PA and SA samples were an average spectra between the liquid and solid form spectra
3.11. Lipid Composition Changes Analysis
In order to further quantify the changes in the composition of the fatty acids-treated LNCaP cancer cells’ lipid droplets compared to those of the control cancer cells, the least square fit was performed utilizing the full experimental Raman spectrum and discriminative Raman peaks selected by the SVM software, as opposed to ratios of values at particular bands. The experimental spectra were assumed as being a linear combination of spectra of pure fatty acid components in the fitting process. A cytoplasm component was not included in the fit because the lipid droplet size was bigger than the detection volume of the Raman microscope, and the cytoplasm signal was not recorded. The goal of this study was to perform an analysis of the FAMEs stored by the LNCaP cancer cells, and therefore the cholesterol spectra were also not included in the analysis. The cholesterol investigation would be the subject of another study in the near future.
Use the Raman spectra of individual pure samples and mixtures of the pure samples in the low wavenumber regions used for the fitting routine, which are shown in Fig. 2a, b, respectively, and the Raman spectra of the LNCaP cells with the discriminative wavenumbers (dotted lines) found by the SVM routine, which are shown in Fig. 3.
Notice the discriminative wavenumbers values (dotted lines in Fig. 3) being as follows: 930, 970, 1003, 1062 cm−1, a larger band around 1110 cm−1, a band around 1417 cm−1, a band around 1456 cm−1, a band around 1655 cm−1, and a band around 1737 cm−1. Use a larger band around the peak at 1110 cm−1 because the ECOC model predicts very high accuracies all over that band (e.g., 0.9858, Fig. 4e) in that region and a very narrow band in the region below 1080 cm−1 due to peaks’ overlapping.
Perform the fits for low wavenumber regions for FAMEs-responsive LNCaP cells to compare changes in intracellular lipid composition upon FAMEs treatment to the lipid composition of the control LNCaP cancer cells. Perform fits without the SVM peak selection (Figs. 7a and 8a) and with the SVM peaks selection (Figs. 7b and 8b).
-
Notice the trend of the coefficients for each of the LNCaP cancer cell lines: control, treated by different fatty acids, and a mixture of fatty acids.
Notice the changes in intracellular lipids in the LNCaP cancer cells upon exposure to individual fatty acids (Fig. 7b) or control and a mixture of fatty acids (Fig. 8b). This is due to fatty acids-mediated lipogenesis and lipid droplet formation. We noticed that the treatment with individual fatty acids produced more of that fatty acid, for example, OA treatment produced more OA. However, the treatment with SA and PA produced more OA. The likely explanation is that after absorption, the saturated SA molecules are converted rapidly to the monounsaturated OA by the formation of a double carbon bond, mediated by the enzyme SCD1 [30]. Another interesting result is that the OA and SA treatments similarly affect the changes in the lipid droplet composition, with very little differences. This has been seen in [31], where SA has a beneficial effect on lowering the low-density lipoprotein (LDL). We also noticed that the PA is not readily converted to the POA. However, PA is converted to OA by a two-reaction pathway. It starts with a conversion reaction from PA to SA (16:0 to 18:0), by elongation followed by desaturation, resulting in the generation of the monounsaturated acid OA. The treatment with LOA produces some LOA and also more AA, likely due to the elongation and desaturation steps. The treatment with POA produces more POA but also PA. The control LNCaP cancer cell line is more saturated than the one treated with a mixture of fatty acids. Thus, the unsaturated fatty acids (OA, LOA, and POA) are canceling or neutralizing the effect of the saturated fatty acids (SA and PA), making the LDs of these samples less saturated. Overall, OA is a predominant fatty acid in the LD of LNCaP cells. The addition of a mixture of fatty acids changes the composition and saturation of the LD, but OA remains the main constituent (Figs. 7b and 8b).
Notice the low wavenumber data resulted in fits with lower standard deviations. This is likely due to the fact that the low wavenumber spectra have more discrete peaks that can be better separated in the fitting routine.
Fig. 8.
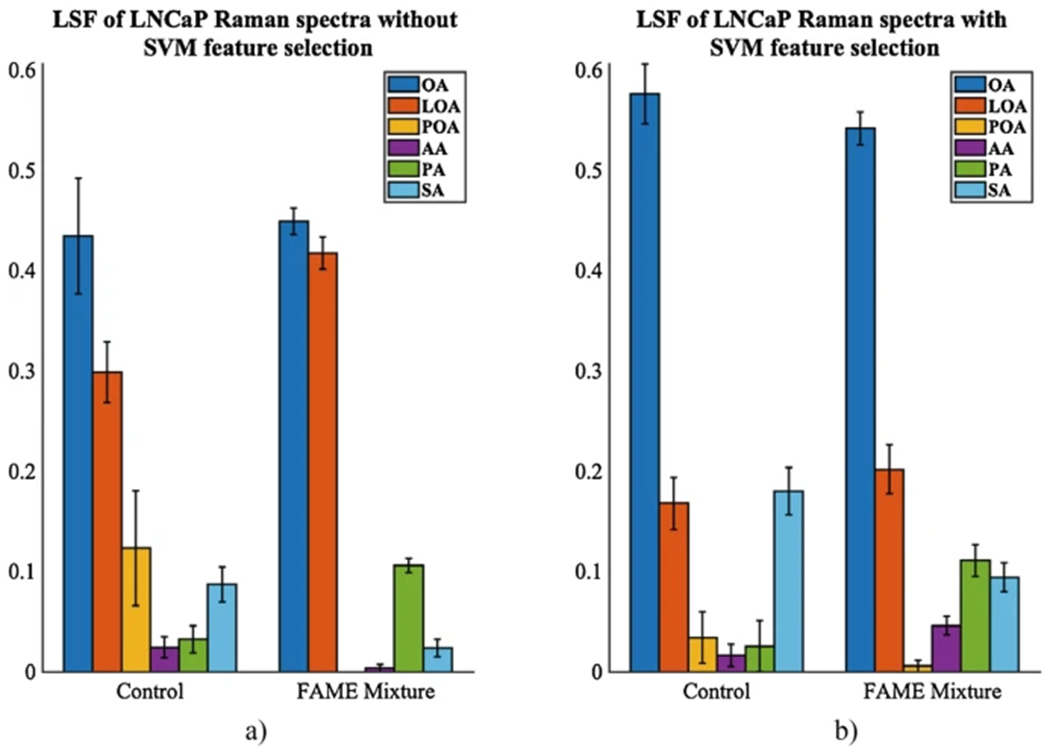
Relative concentrations of fatty acids from least squares fit of experimental Raman measurements of lipid droplets for control and FAMEs mixture-treated LNCaP without SVM (a) and with SVM (b). Standard deviations are shown. OA oleic acid, POA palmitoleic acid, LOA linoleic acid, AA arachidonic acid, PA palmitic acid, SA stearic acid. PA and SA samples spectra were recorded in liquid form and solid form as well by melting the solid samples with a heat gun. The final spectra for PA and SA samples were an average spectra between the liquid and solid form spectra
Acknowledgments
This work was supported by the American Cancer Society 129846-RSG-16-256 (IS) and NIH NCI K01CA168934 (IS), DARPA N66001-10-1-4035 (EG).
4 Notes
There are some sharp spikes in the spectra, which are typically narrower than the Raman peaks. These spikes are the cause of cosmic rays hitting the detector, and they need to be removed before going deeper into data analysis. You can use the Savitzky-Golay (SG) filter, sgolayfilt(). Sometimes, this filter needs an extra processing step to remove the spikes, and you can use a thresholding method based on data’s histogram after using the SG filter.
Recording a group of five Raman spectra of media outside the cell area, from a point scan, in the region between 300 and 1800 cm−1 is mandatory due to a very intense signal from the media and coverslips.
Baseline correction is needed due to imperfect removal of the background. Use the function msbackadj() regression method with various combinations of parameters: quantilevalue, win-dowsize, stepsize, and regressionmethod to get a better fit of the data.
Find the most important Raman peaks of the polystyrene beads in the recorded spectra by using the function findpeaks() and find the corresponding peaks in the polystyrene beads calibration charts of the Mccreery’s group [32]. Interpolate the measured peaks versus the actual peaks to obtain the calibrated Raman shifts.
Find the best accuracy (>0.92) by combining two by two Raman peaks. Example: choose the peak at 1448 cm−1 fixed and run the ECOC classifier by selecting this peak and a different one from 800 to 1800 cm−1. Keep the combination of peaks with accuracy >0.92.
Use the function lsqnonneg() to compare the sample spectra with the standard pure fatty acid spectra, constraining the coefficients to positive values.
Use the function barweb() to produce bar graphs with error bars.
As an additional metric, there is another way to look at the relative concentrations between the saturated fatty acids (PA-palmitic and SA-stearic) and the unsaturated fatty acids (OA-oleic, LOA-linoleic, POA-palmitoleic, and AA-arachidonic). This can be represented as percent saturation (namely, saturated FA concentration divided by total FA concentration). This approach could be followed to assess the unsaturation/saturation degrees only when there is more information on all fatty acid compositions and cholesterol. Using this metric for predicting the unsaturation or saturation degrees using only five or six fatty acids as a reference will underestimate the results. It will take further investigation to state accurately the relative concentrations of fatty acids and cholesterol inside LDs.
References
- 1.Fujimoto T, Ohsaki Y, Cheng J, Suzuki M, Shinohara Y (2008) Lipid droplets: a classic organelle with new outfits. Histochem Cell Biol 130(2):263–279. 10.1007/s00418-008-0449-0 [DOI] [PMC free article] [PubMed] [Google Scholar]
- 2.Olofsson SO, Bostrom P, Andersson L, Rutberg M, Perman J, Boren J (2009) Lipid droplets as dynamic organelles connecting storage and efflux of lipids. Biochim Biophys Acta 1791(6):448–458. 10.1016/j.bbalip.2008.08.001 [DOI] [PubMed] [Google Scholar]
- 3.Kuhajda FP (2006) Fatty acid synthase and cancer: new application of an old pathway. Cancer Res 66(12):5977–5980. 10.1158/0008-5472.can-05-4673 [DOI] [PubMed] [Google Scholar]
- 4.Warburg O (1956) On the origin of cancer cells. Science (New York, NY) 123 (3191):309–314 [DOI] [PubMed] [Google Scholar]
- 5.Santos CR, Schulze A (2012) Lipid metabolism in cancer. FEBS J 279(15):2610–2623. 10.1111/j.1742-4658.2012.08644.x [DOI] [PubMed] [Google Scholar]
- 6.Suburu J, Chen YQ (2012) Lipids and prostate cancer. Prostaglandins Other Lipid Mediat 98 (1–2):1–10. 10.1016/j.prostaglandins.2012.03.003 [DOI] [PMC free article] [PubMed] [Google Scholar]
- 7.Swinnen JV, Heemers H, de Sande TV, Schrijver ED, Brusselmans K, Heyns W, Verhoeven G (2004) Androgens, lipogenesis and prostate cancer. J Steroid Biochem Mol Biol 92 (4):273–279. 10.1016/j.jsbmb.2004.10.013 [DOI] [PubMed] [Google Scholar]
- 8.Chalbos D, Joyeux C, Galtier F, Rochefort H (1992) Progestin-induced fatty acid synthetase in human mammary tumors: from molecular to clinical studies. J Steroid Biochem Mol Biol 43 (1–3):223–228. 10.1016/0960-0760(92)90211-Z [DOI] [PubMed] [Google Scholar]
- 9.Schlaepfer IR, Hitz CA, Gijon MA, Bergman BC, Eckel RH, Jacobsen BM (2012) Progestin modulates the lipid profile and sensitivity of breast cancer cells to docetaxel. Mol Cell Endocrinol 363(1–2):111–121. 10.1016/j.mce.2012.08.005 [DOI] [PMC free article] [PubMed] [Google Scholar]
- 10.Vapnik VN (1995) The nature of statistical learning theory. Springer, New York, NY [Google Scholar]
- 11.Vapnik VN (1998) Statistical learning theory. Wiley-Interscience, New York, NY [Google Scholar]
- 12.Potcoava MC, Futia GL, Aughenbaugh J, Schlaepfer IR, Gibson EA (2014) Raman and coherent anti-Stokes Raman scattering microscopy studies of changes in lipid content and composition in hormone-treated breast and prostate cancer cells. J Biomed Opt 19 (11):111605. 10.1117/1.JBO.19.11.111605 [DOI] [PMC free article] [PubMed] [Google Scholar]
- 13.Feuerstein D, Parker KH, Boutelle MG (2009) Practical methods for noise removal: applications to spikes, nonstationary quasi-periodic noise, and baseline drift. Anal Chem 81 (12):4987–4994. 10.1021/ac900161x [DOI] [PubMed] [Google Scholar]
- 14.Weng YM, Weng RH, Tzeng CY, Chen W (2003) Structural analysis of triacylglycerols and edible oils by near-infrared Fourier transform Raman spectroscopy. Appl Spectrosc 57 (4):413–418. 10.1366/00037020360625952 [DOI] [PubMed] [Google Scholar]
- 15.Frank CJ, Redd DC, Gansler TS, McCreery RL (1994) Characterization of human breast biopsy specimens with near-IR Raman spectroscopy. Anal Chem 66(3):319–326 [DOI] [PubMed] [Google Scholar]
- 16.Kint S, Wermer PH, Scherer JR (1992) Raman spectra of hydrated phospholipid bilayers. 2. Water and head-group interactions. J Phys Chem 96(1):446–452. 10.1021/j100180a082 [DOI] [Google Scholar]
- 17.Susi H, Sampugna J, Hampson JW, Ard JS (1979) Laser-Raman investigation of phospholipid-polypeptide interactions in model membranes. Biochemistry 18 (2):297–301. 10.1021/bi00569a010 [DOI] [PubMed] [Google Scholar]
- 18.Lawson EE, Anigbogu AN, Williams AC, Barry BW, Edwards HG (1998) Thermally induced molecular disorder in human stratum corneum lipids compared with a model phospholipid system; FT-Raman spectroscopy. Spectrochim Acta A Mol Biomol Spectrosc 54A(3):543–558 [DOI] [PubMed] [Google Scholar]
- 19.Zerbi G, Conti G, Minoni G, Pison S, Bigotto A (1987) Premelting phenomena in fatty acids: an infrared and Raman study. J Phys Chem 91 (9):2386–2393. 10.1021/j100293a038 [DOI] [Google Scholar]
- 20.Snyder RG, Cameron DG, Casal HL, Compton DAC, Mantsch HH (1982) Studies on determining conformational order in n-alkanes and phospholipids from the 1130 cm−1 Raman band. Biochim Biophys Acta Biomembr 684(1):111–116. 10.1016/0005-2736(82)90054-2 [DOI] [Google Scholar]
- 21.Sadeghi-Jorabchi H, Hendra PJ, Wilson RH, Belton PS (1990) Determination of the total unsaturation in oils and margarines by Fourier transform Raman spectroscopy. J Am Oil Chem Soc 67(8):483–486. 10.1007/BF02540752 [DOI] [Google Scholar]
- 22.Beattie JR, Bell SE, Moss BW (2004) A critical evaluation of Raman spectroscopy for the analysis of lipids: fatty acid methyl esters. Lipids 39 (5):407–419 [DOI] [PubMed] [Google Scholar]
- 23.Chan JW, Motton D, Rutledge JC, Keim NL, Huser T (2005) Raman spectroscopic analysis of biochemical changes in individual triglyceride-rich lipoproteins in the pre- and postprandial state. Anal Chem 77 (18):5870–5876. 10.1021/ac050692f [DOI] [PubMed] [Google Scholar]
- 24.den Hartigh LJ, Connolly-Rohrbach JE, Fore S, Huser TR, Rutledge JC (2010) Fatty acids from very low-density lipoprotein lipolysis products induce lipid droplet accumulation in human monocytes. J Immunol 184 (7):3927–3936. 10.4049/jimmunol.0903475 [DOI] [PMC free article] [PubMed] [Google Scholar]
- 25.Schie IW, Wu J, Weeks T, Zern MA, Rutledge JC, Huser T (2011) Label-free imaging and analysis of the effects of lipolysis products on primary hepatocytes. J Biophotonics 4 (6):425–434. 10.1002/jbio.201000086 [DOI] [PMC free article] [PubMed] [Google Scholar]
- 26.Frank CJ, McCreery RL, Redd DCB (1995) Raman spectroscopy of normal and diseased human breast tissues. Anal Chem 67 (5):777–783. 10.1021/ac00101a001 [DOI] [PubMed] [Google Scholar]
- 27.Hanuš J (1901) Die Anwendung von Jodmonobromid bei der Analyse von Fetten und Oelen. Zeitschrift für Untersuchung der Nahrungs-und Genußmittel, sowie der Gebrauchsgegenstände 4:8. 10.1007/BF02431226 [DOI] [Google Scholar]
- 28.Ham B, Shelton R, Butler B, Thionville P (1998) Calculating the iodine value for marine oils from fatty acid profiles. J Am Oil Chem Soc 75(10):1445–1446. 10.1007/s11746-998-0197-2 [DOI] [Google Scholar]
- 29.Samek O, Joná¡ A, Pilát Z, Zemánek P, Nedbal L, Tříska J, Kotas P, Tríilek M (2010) Raman microspectroscopy of individual algal cells: sensing unsaturation of storage lipids in vivo. Sensors 10(9):8635. [DOI] [PMC free article] [PubMed] [Google Scholar]
- 30.Mason P, Liang B, Li L, Fremgen T, Murphy E, Quinn A, Madden SL, Biemann HP, Wang B, Cohen A, Komarnitsky S, Jancsics K, Hirth B, Cooper CG, Lee E, Wilson S, Krumbholz R, Schmid S, Xiang Y, Booker M, Lillie J, Carter K (2012) SCD1 inhibition causes cancer cell death by depleting mono-unsaturated fatty acids. PLoS One 7(3):e33823. 10.1371/journal.pone.0033823 [DOI] [PMC free article] [PubMed] [Google Scholar]
- 31.Hunter JE, Zhang J, Kris-Etherton PM (2009) Cardiovascular disease risk of dietary stearic acid compared with trans, other saturated, and unsaturated fatty acids: a systematic review. Am J Clin Nutr 91(1):46–63. 10.3945/ajcn.2009.27661 [DOI] [PubMed] [Google Scholar]
- 32.McCreery RL (n.d.) Raman materials. https://www.chem.ualberta.ca/~mccreery/raman.html


