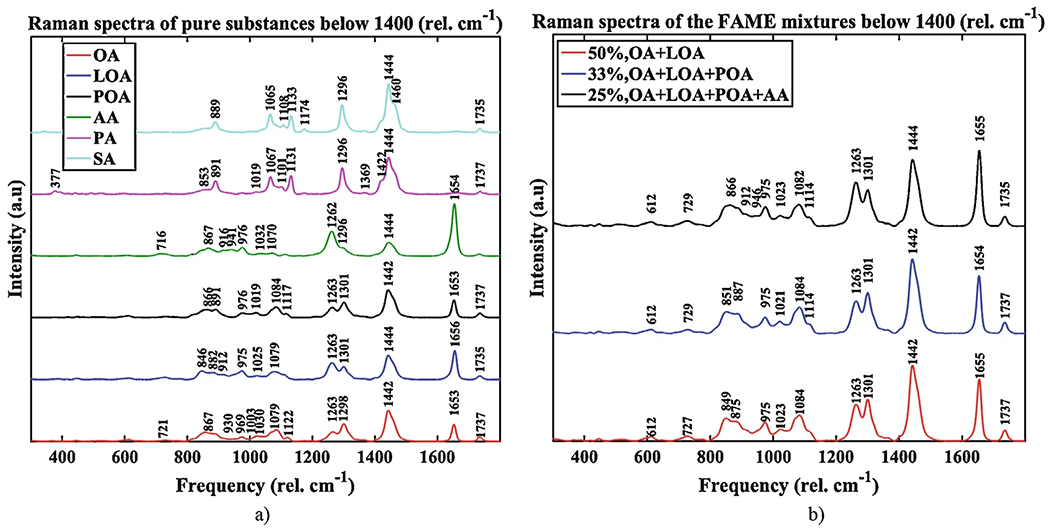
Fig. 2.

FAME Raman spectra below 1800 cm−1; (a) Raman spectra of individual FAME; the pure substances are, from the bottom to the top, oleate OA (Sigma, >99% GC), linoleate LOA (Sigma, >99%), palmitoleate POA (Sigma, >98.5%, GC), arachidonate AA (Sigma, >99%), palmitate PA (Sigma, >99%, GC), and stearate SA (Sigma, >99%, GC); we recorded the palmitate and stearate samples spectra in solid and liquid form (not shown) by melting the solid samples, and the solid and liquid spectra were averaged; (b) Raman spectra of FAME mixtures: 50% OA + LOA, 33% OA + LOA + POA, and 25% OA + LOA + POA + AA. OA oleic acid, POA palmitoleic acid, LOA linoleic acid, AA arachidonic acid, PA palmitic acid, SA stearic acid
