Fig. 6.

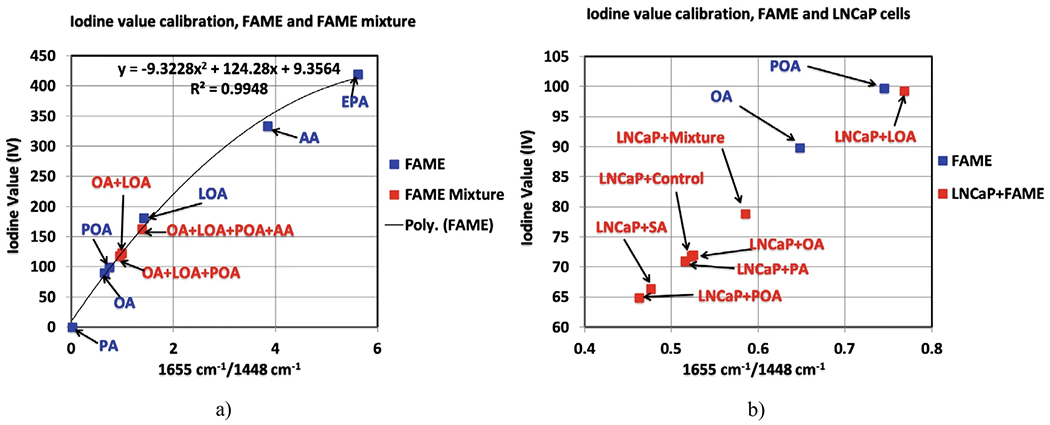
Iodine values calibration; (a) Individual FAME and mixture of FAME; (b) Individual FAME and LNCaP treated with FAME. We kept the POA and OA on the calibration curve to be able to expand the region between the PA and POA

Iodine values calibration; (a) Individual FAME and mixture of FAME; (b) Individual FAME and LNCaP treated with FAME. We kept the POA and OA on the calibration curve to be able to expand the region between the PA and POA