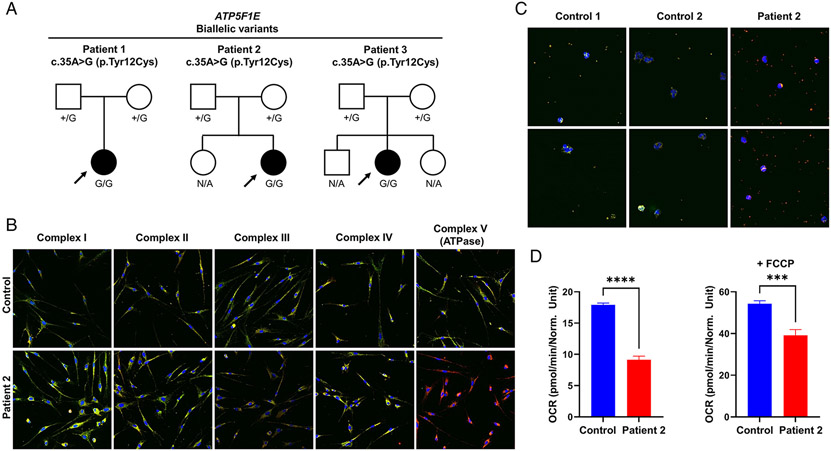
Figure 2: Biallelic ATP5F1E variants identified in 3 cases.
(a) Pedigree drawings for 3 families with the homozygous variant in ATP5F1E. N/A, no genotyping available. (b) Fluorescence staining of patient 2`s primary human skin fibroblasts and a fibroblast control line. Cells were stained with antibodies raised against subunits of the five OXPHOS complexes (green) and an antibody against VDAC1 (red). The merge is shown. A shift to red indicates a reduction of the respective OXPHOS subunit. The images were taken with a 200x magnification. The experiment was performed with analysis of six different control lines (data not shown) and repeated twice with similar results. (c) Fluorescence staining of blood smears from patient 2 and two different control lines. Cells were stained with an antibody raised against the ATP5F1A subunit of ATPase (green) and an antibody against VDAC1 (red). The merge is shown. A shift to red indicates a reduction of the ATP5F1A subunit. The images were taken with a 400x magnification. The experiment was repeated twice with similar results. (d) Measurement of oxygen consumption rate (OCR) in patient 2`s fibroblasts and a control line. Data show the mean values ± SEM of basal respiration (left graph) and of maximal respiration after addition of FCCP (right graph); number of replicates: patient=4; control=8; ***p<0.001, ****p<0.0001.

