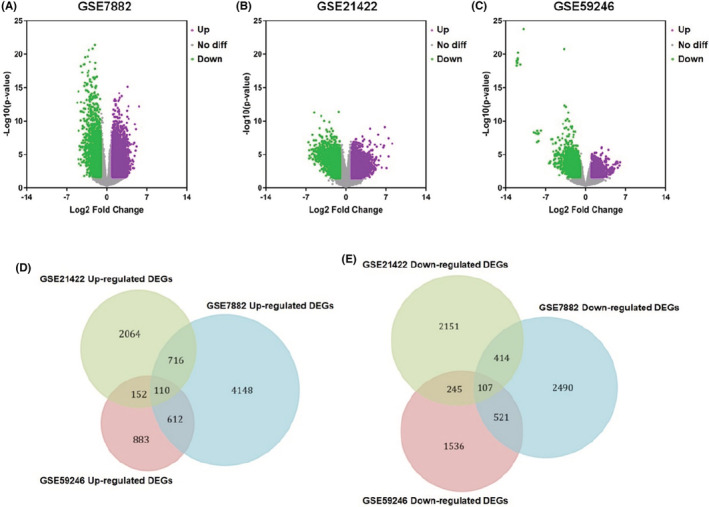
FIGURE 1.

Identification of the differentially expressed genes in DCIS. (A–C) Upregulated and downregulated genes are represented by purple and green points. In gray points, there are no genes with differential expression. (A) DEGs based on GSE7882. (B) DEGs based on GSE21422. (C) DEGs based on GSE59246. (D) Co‐upregulated genes from GSE7882, GSE21422, and GSE59246 microarray profile datasets. (E) Co‐downregulated genes from GSE7882, GSE21422, and GSE59246 microarray profile datasets.
