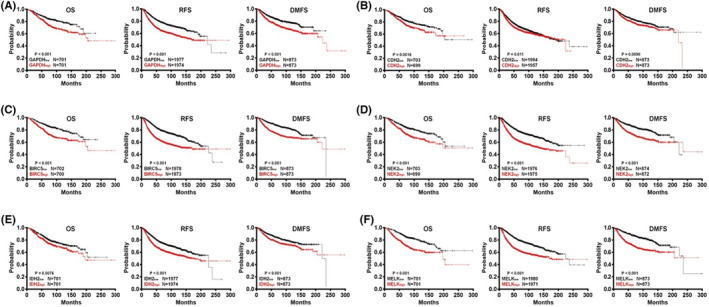
FIGURE 4.

Prognostic of core candidate genes in DCIS according to the Kaplan–Meier plotter database. (A) GAPDH (M33197_3_at). (B) CDH2 (203440_at). (C) BIRC5 (202095_s_at). (D) NEK2 (204641_at). (E) IDH2 (210046_s_at). (F) MELK (204825_at). Patients with high gene expression are represented by red lines, whereas black lines exemplify those with low gene expression. OS stands for overall survival. RFS stands for “relapse‐free survival.” Distance metastasis‐free survival is abbreviated as DMFS.
