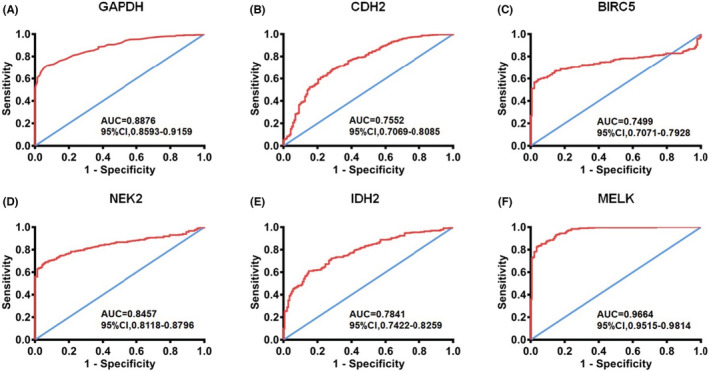
FIGURE 5.

Validation ROC curves of hub genes based on TCGA cohort. (A) ROC curve of GAPDH. (B) ROC curves of CDH2. (C) ROC curves of BIRC5. (D) ROC curves of NEK2. (E) ROC curves of IDH2. (F) ROC curves of MELK. Red represents sensitive curves; blue indicates identity lines. ROC, receiver operating characteristic; AUC, Area under the curve; CI, Confidence interval.
