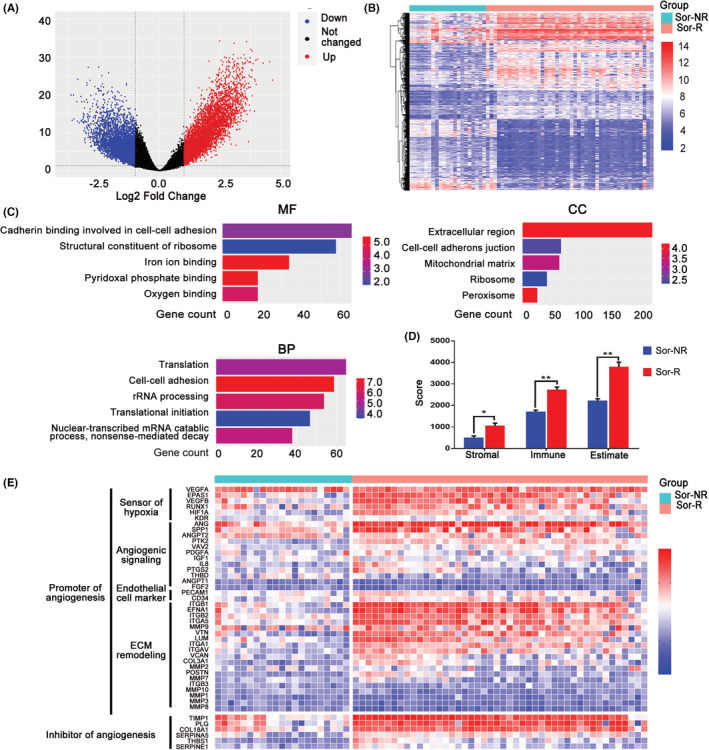
FIGURE 1.

DEGs and DE‐pathways between Sor‐R and Sor‐NR HCC patients. (A) Volcano plot of DEGs between group of Sor‐R and Sor‐NR HCC patients. Black dots, blue dots and red dots represent unchanged, down‐regulated, and up‐regulated genes in Sor‐R group compared to Sor‐NR group, respectively. (B) Heatmap of DEGs between group of Sor‐R and Sor‐NR HCC patients. (C) GO functional enrichment analysis of DEGs between group of Sor‐R and Sor‐NR HCC patients. (D) The Stromal score, Immune score, and Estimate score between group of Sor‐NR and Sor‐R HCC patients. (E) Heatmap of genes involved in angiogenesis between group of Sor‐R and Sor‐NR HCC patients. DEGs, differentially expressed genes; HCC, hepatocellular carcinoma; Sor‐NR, Sorafenib‐non‐resistant; Sor‐R, Sorafenib‐resistant. *: p〈0.05; **: p〈0.01.
