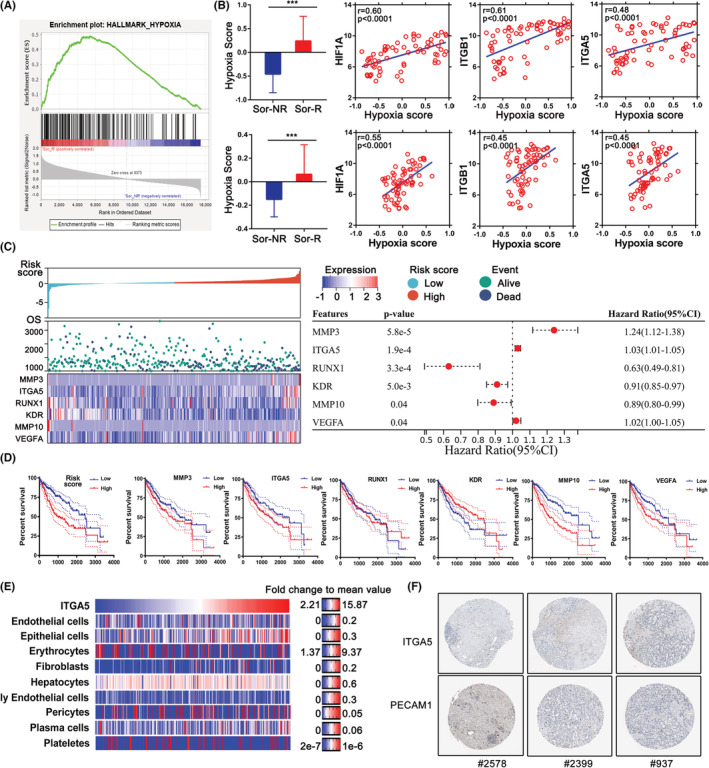
FIGURE 2.

Evaluation of hypoxic character in Sor‐R and Sor‐NR HCC patients from TCGA database. (A) GSEA result between Sor‐R and Sor‐NR HCC patients by using Hallmark Hypoxia gene set. (B) Buffa's (upper) and Winter's (lower) hypoxia model was used to calculate hypoxia score of Sor‐R and Sor‐NR HCC patients. (B) Correlation between hypoxia score with ITGA5 or ITGB1 in Sor‐R or Sor‐NR HCC patients. (C) OS analyses by single marker cut‐offs optimized using multivariate Cox regression. (D) Kaplan–Meier method was used to compute overall survival of HCC patients from TCGA database with distinct expression of candidate genes. (E) Heatmap of ITGA5 level and vessel‐related cells in using xCell algorithm in TCGA‐LIHC cohort. (F) Protein level of ITGA5 and PECAM1 in HCC tissue which were downloaded from the Human Protein Atlas. GSEA, gene set enrichment analysis; HCC, hepatocellular carcinoma; ITGA5, integrins A5; ITGB1, integrins B1; Sor‐R, Sorafenib‐resistant; Sor‐NR, Sorafenib‐non‐resistant; TCGA, the cancer genome atlas. ***: p〈0.001.
