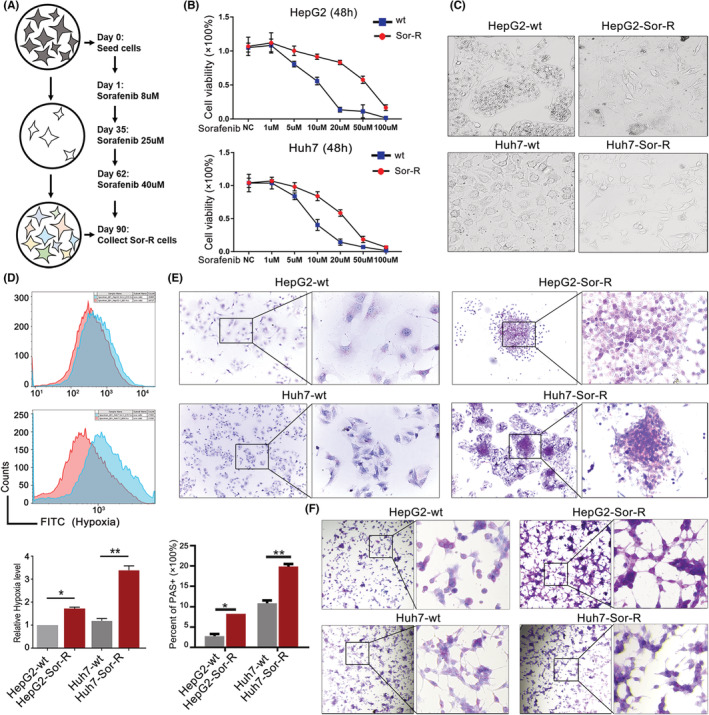
FIGURE 3.

ITGA5 and ITGB1 boosted VM formation. (A) Workflow diagram of constructing Sor‐R cell lines. (B) Confirmation of tolerance to Sorafenib in Sor‐R cells by cell killing assay. (C) Observation of morphological change in HCC cells resistant to Sorafenib compared to original cells. (D) Hypoxia level detection in Sorafenib‐resistant HepG2/Huh7 cells via flow cytometry assay. The red curve represents control, and the blue curves represent the Sorafenib‐resistant HepG2/Huh7 cells. (E) Detection of VM structure in wildtype and Sor‐R cells on glass slides by PAS staining. (F) Detection of VM structure in wildtype and Sor‐R cells on 3D scaffolds by PAS staining. HCC, hepatocellular carcinoma; ITGA5, integrins A5; ITGB1, integrins B1; PAS, periodic acid schiff; Sor‐R, Sorafenib‐resistant; VM, vasculogenic mimicry. *: p〈0.05 ; **: p〈0.01.
