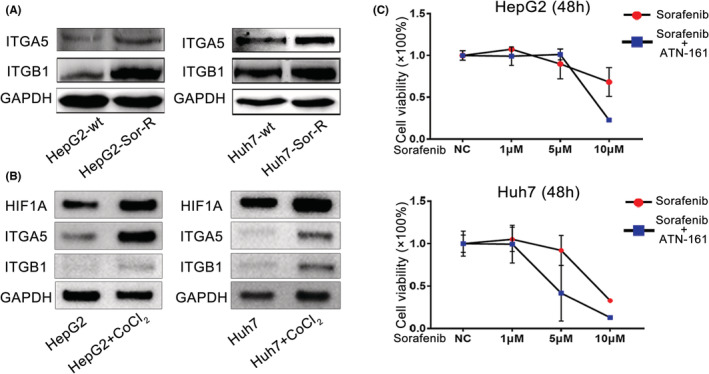
FIGURE 4.

ITGA5 and ITGB1 reduced sensitivity to Sorafenib. (A) Measurement of protein levels of ITGA5 and ITGB1 in wildtype and HepG2/Huh7 Sor‐R cells. (B) Changes of ITGA5 and ITGB1 in HepG2/Huh7 cells treated with 150 μM CoCl2. (C) Measurement of sensitivity to Sorafenib and Sorafenib plus integrin inhibitor (ATN‐161) in HepG2 and Huh7 cells. ITGA5, integrins A5; ITGB1, integrins B1; Sor‐R, Sorafenib‐resistant.
