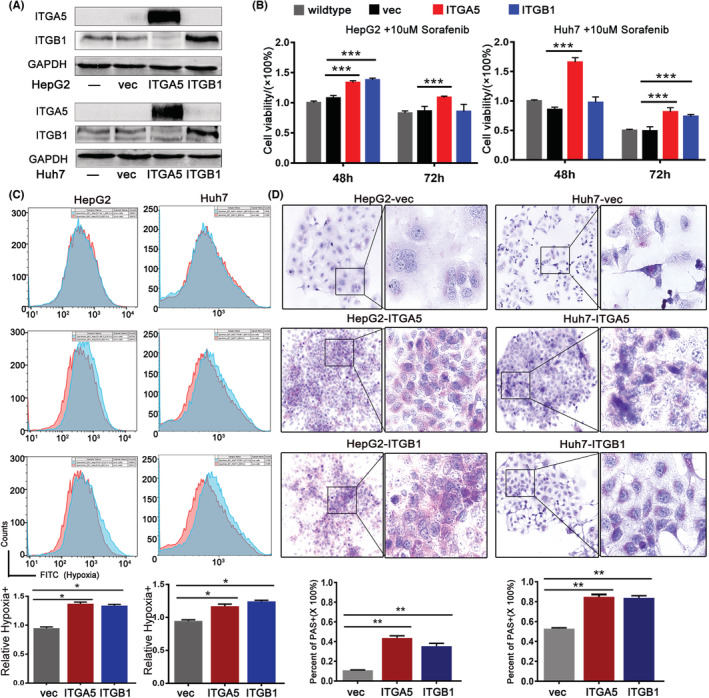
FIGURE 5.

ITGA5 and ITGB1 promoted Sorafenib resistance by enhancing hypoxia and VM formation. (A) Confirmation of ITGA5 or ITGB1 overexpression cells by Western blot. (B) Evaluation of tolerance to Sorafenib in control and ITGA5 or ITGB1 overexpressing cells by cell killing assay. (C) Detection of hypoxia level in control and ITGA5 or ITGB1 overexpressing cells by flow cytometry assay. (D) Quantification of VM structure in control and ITGA5 or ITGB1 overexpressing cells by PAS staining. Microphotographs were collected and uploaded into ImageJ software for quantification. ITGA5, integrins A5; ITGB1, integrins B1; PAS, periodic acid schiff; VM, vasculogenic mimicry. *: p〈0.05 ; **: p〈0.01; ***: p〈0.001.
