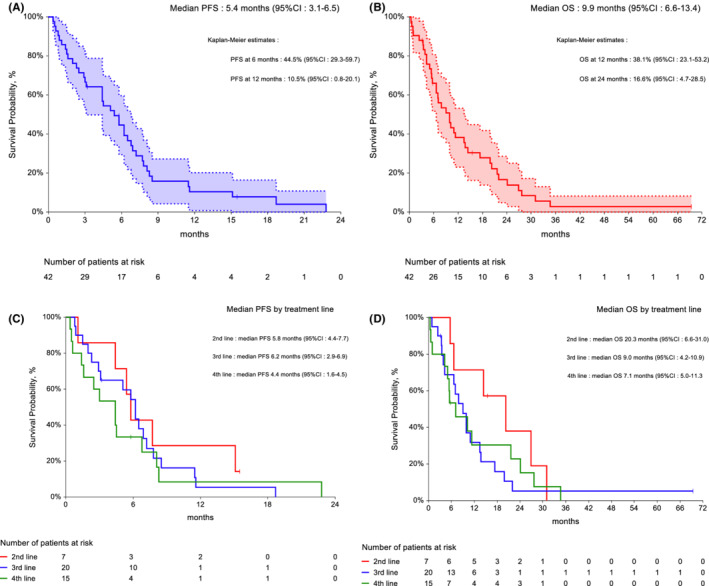
FIGURE 1.

(A) progression‐free survival, n = 42; (B) overall survival, n = 42. Dotted lines indicate 95% confidence intervals. (C) Impact of previous treatment lines on progression‐free survival. (D) Impact of previous treatment lines on overall survival.
